Checking the detected events in tracedisplay.
Visual event check
On this page
The tracedisplay can be used to navigate the events saved in the psysmon database.
Open the tracedisplay dialog
Load the display collection and open the tracedisplay preferences. Select the stations that have been used for the detection binding (MIT:XX:A, MOR:XX:A, PIL:XX:A and STO:XX:00).
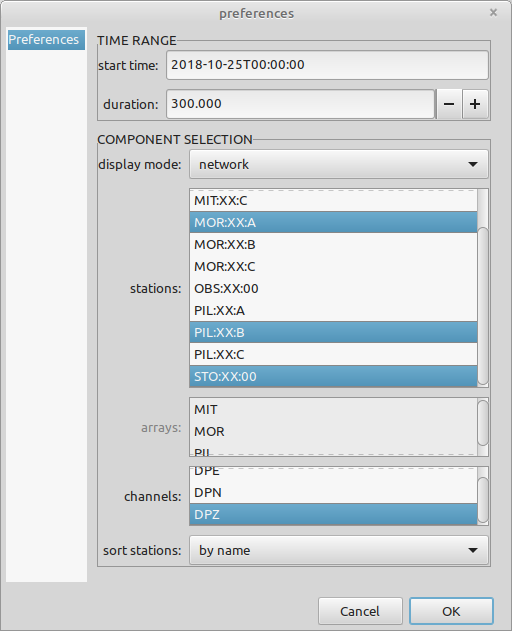
Close the preferences dialog and execute the display collection to open the tracedisplay window. The tracedisplay window should show the seismograms of the 4 selected stations.
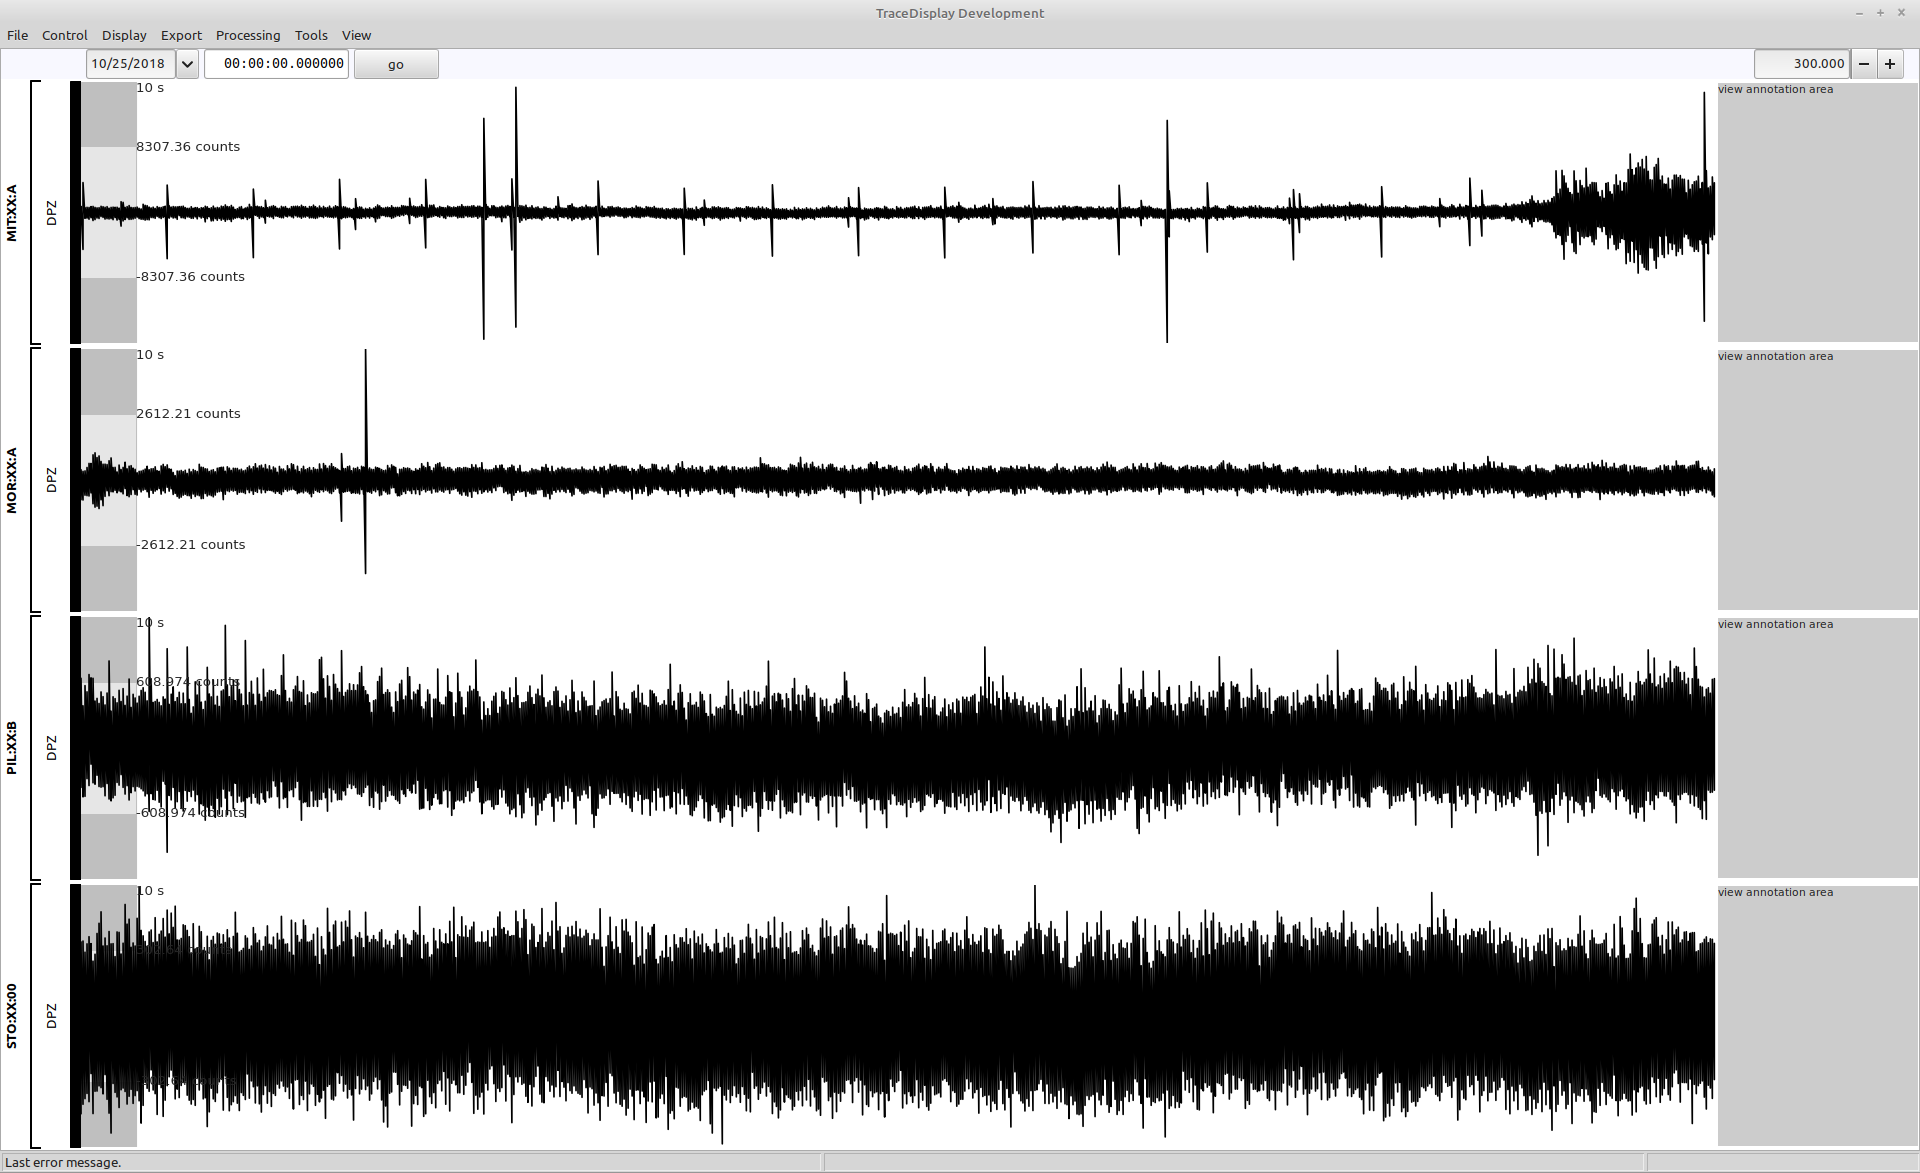
Open the event selector
The events can be browsed using the event selector plugin. Open it using the menu Display->show events. The event selector will open as a docking frame on the right side of the tracedisplay window. Resize it to better see the available parameters.
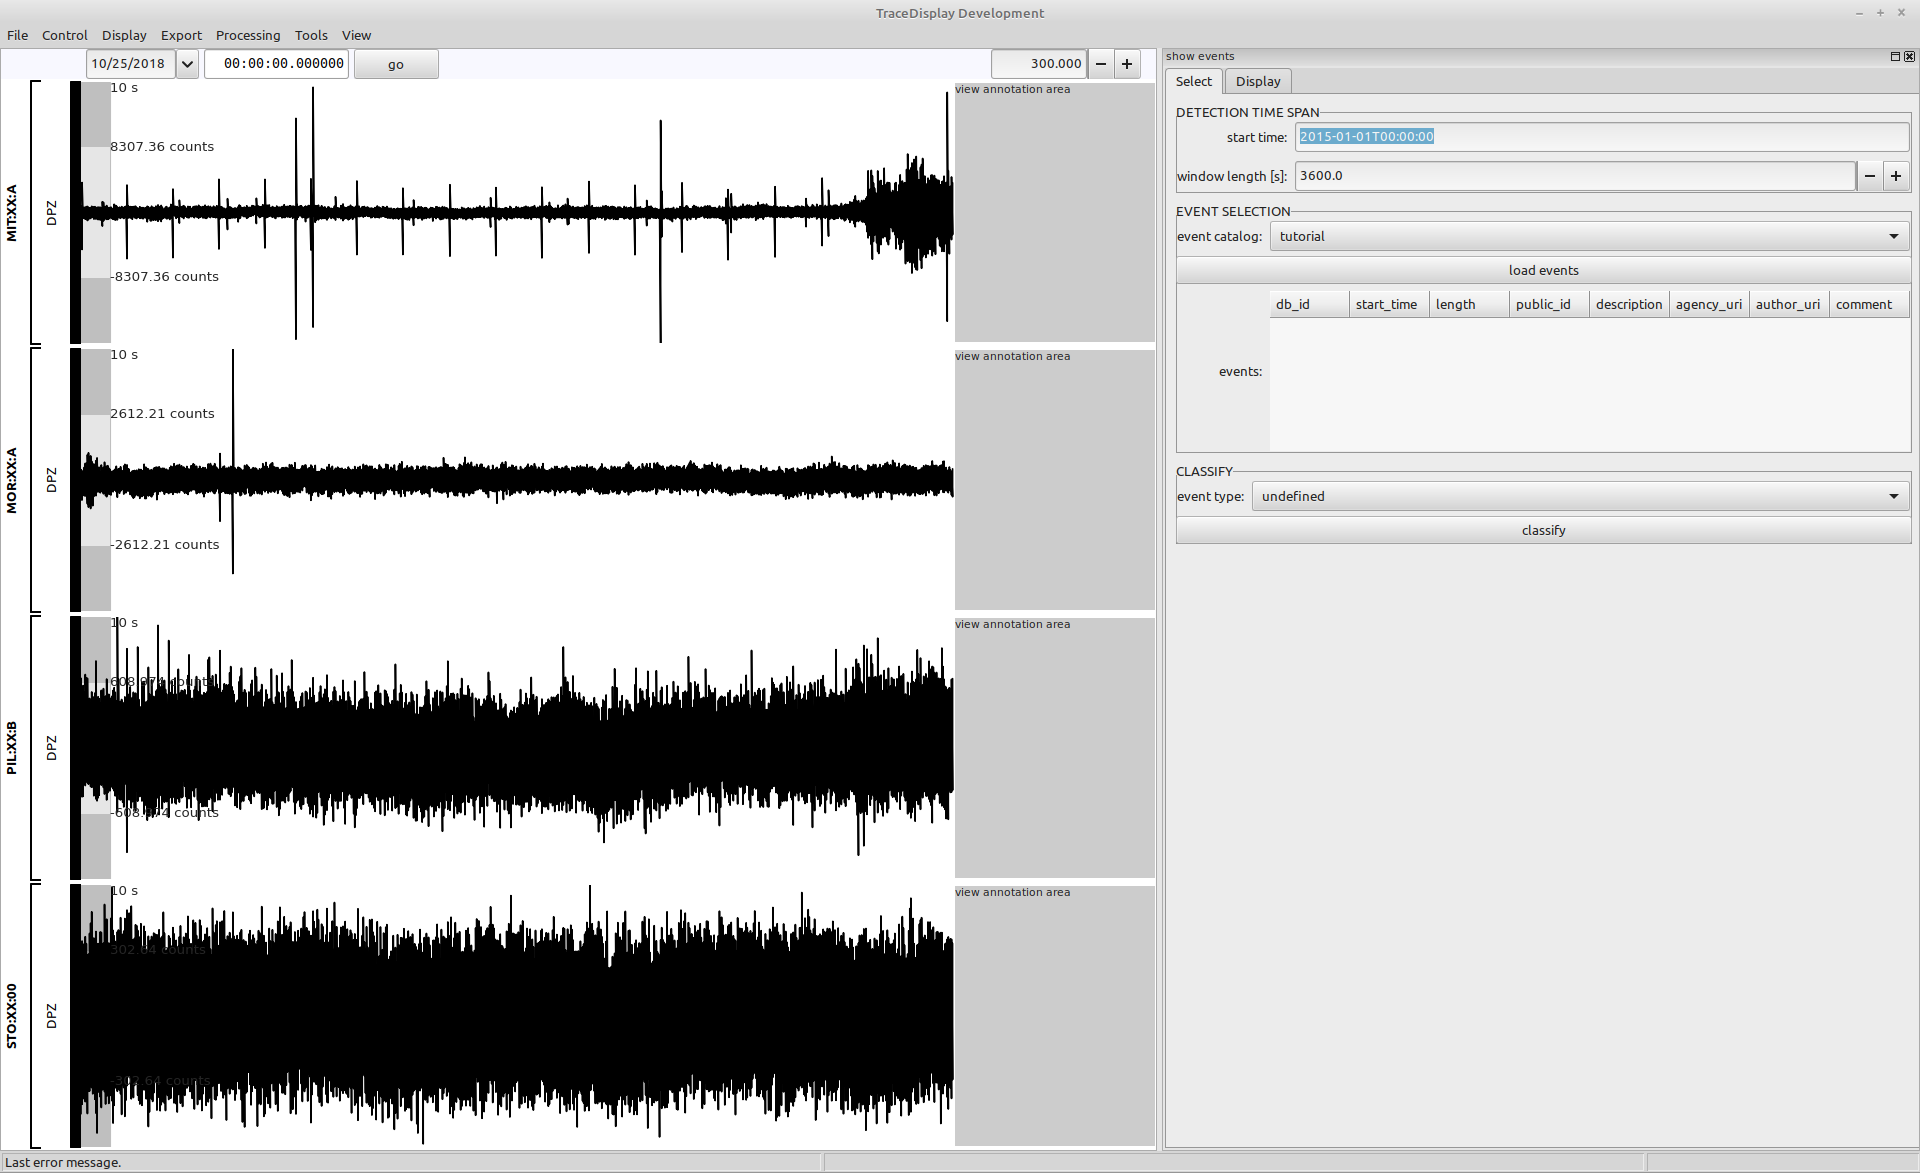
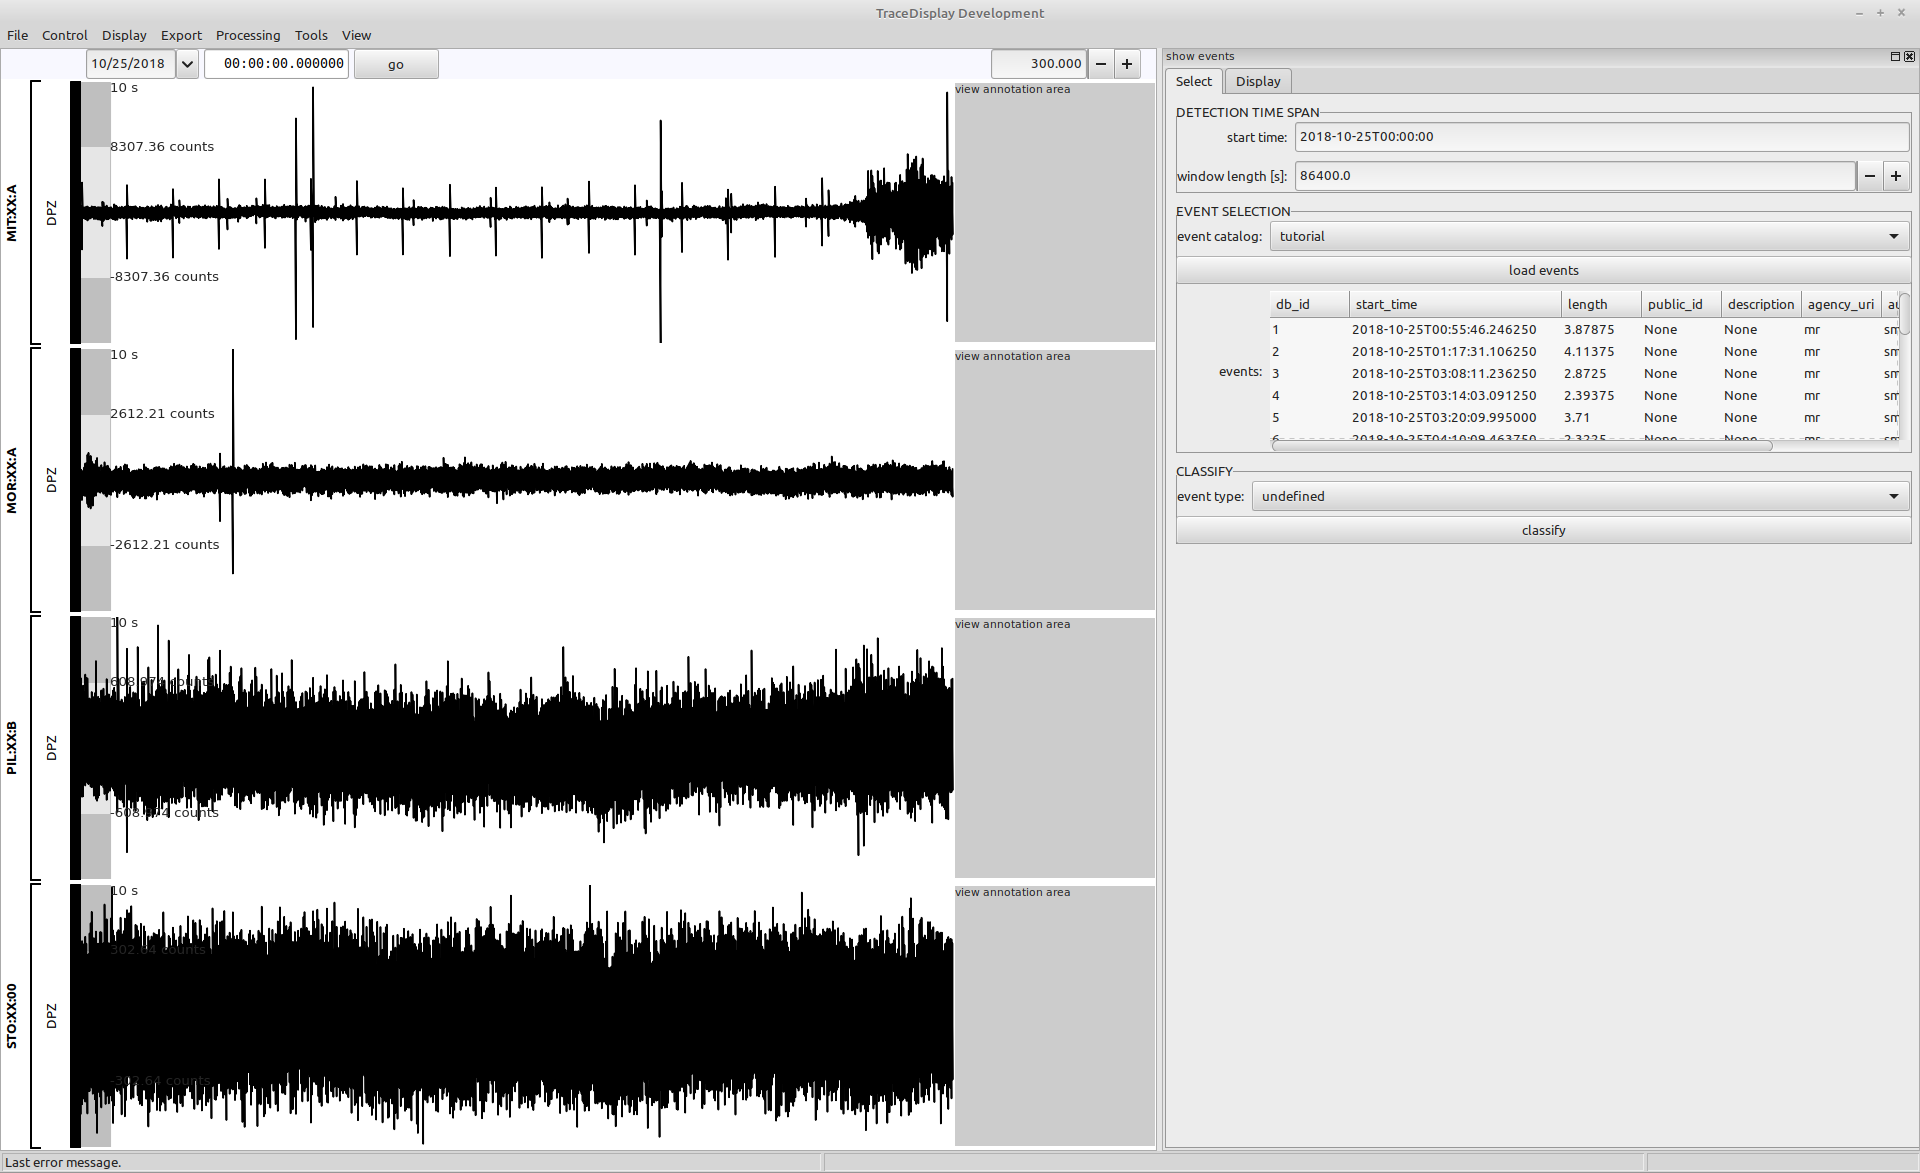
Load the events
In the event selector the events for a given time span can be loaded from an event catalog. Select 2018-10-25T00:00:00 for the start time and a window length of 86400 seconds. Select the event catalog tutorial and click the load events button. This will load all events detected on the day 2018-10-25. The events will be listed in the events table.
Select an event
Select the event with id 32 and start time 2018-10-25T22:57:31.938750. The time span of the displayed data will be changed to the event limits of the selected event. Zoom out to better show the event (click with the mouse into a seismogram view and use the shortcut - to zoom out).
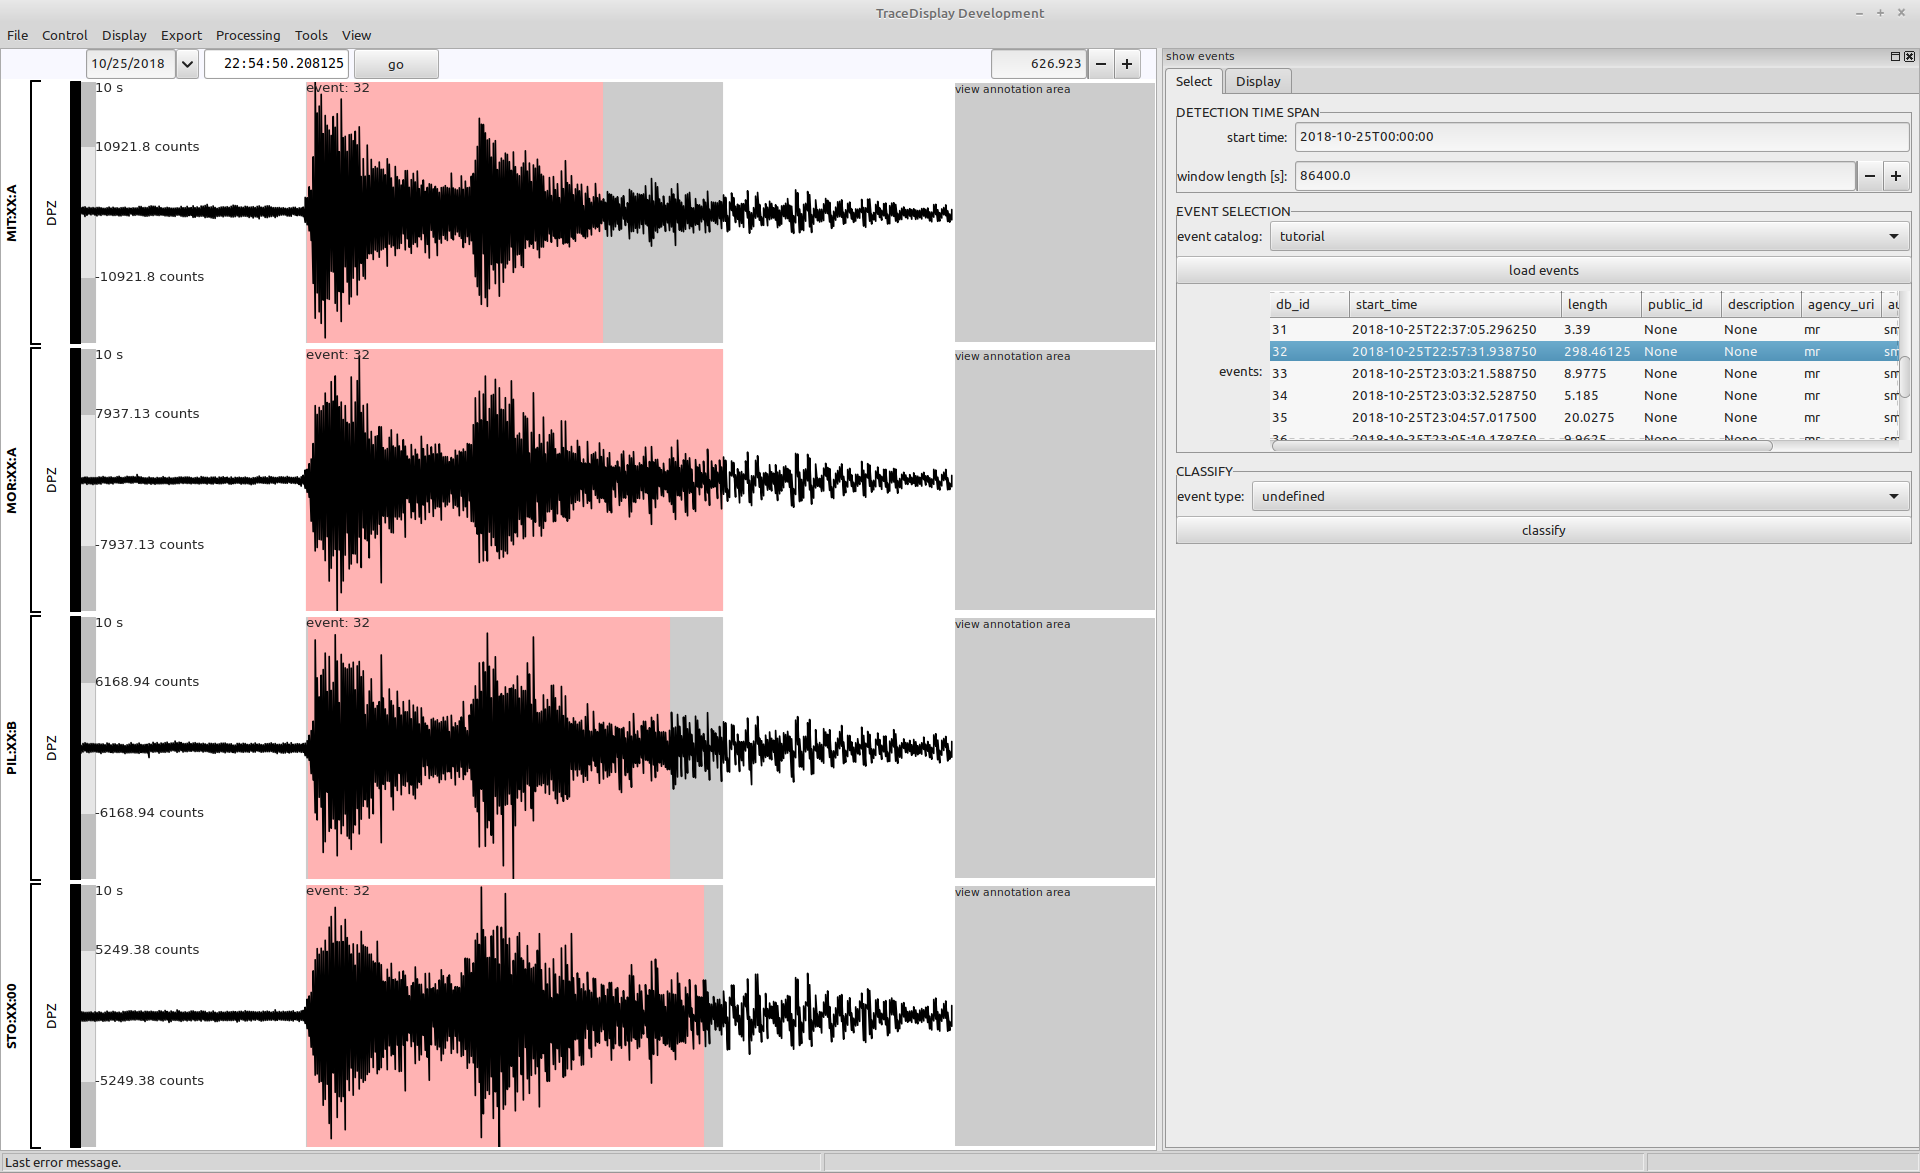
The grey area marks the time limits of the detected event and the light red areas highlight the detections on the individual traces.
You can use the arrow keys in the events table of the event selector to browse through the detected events.
Another event example
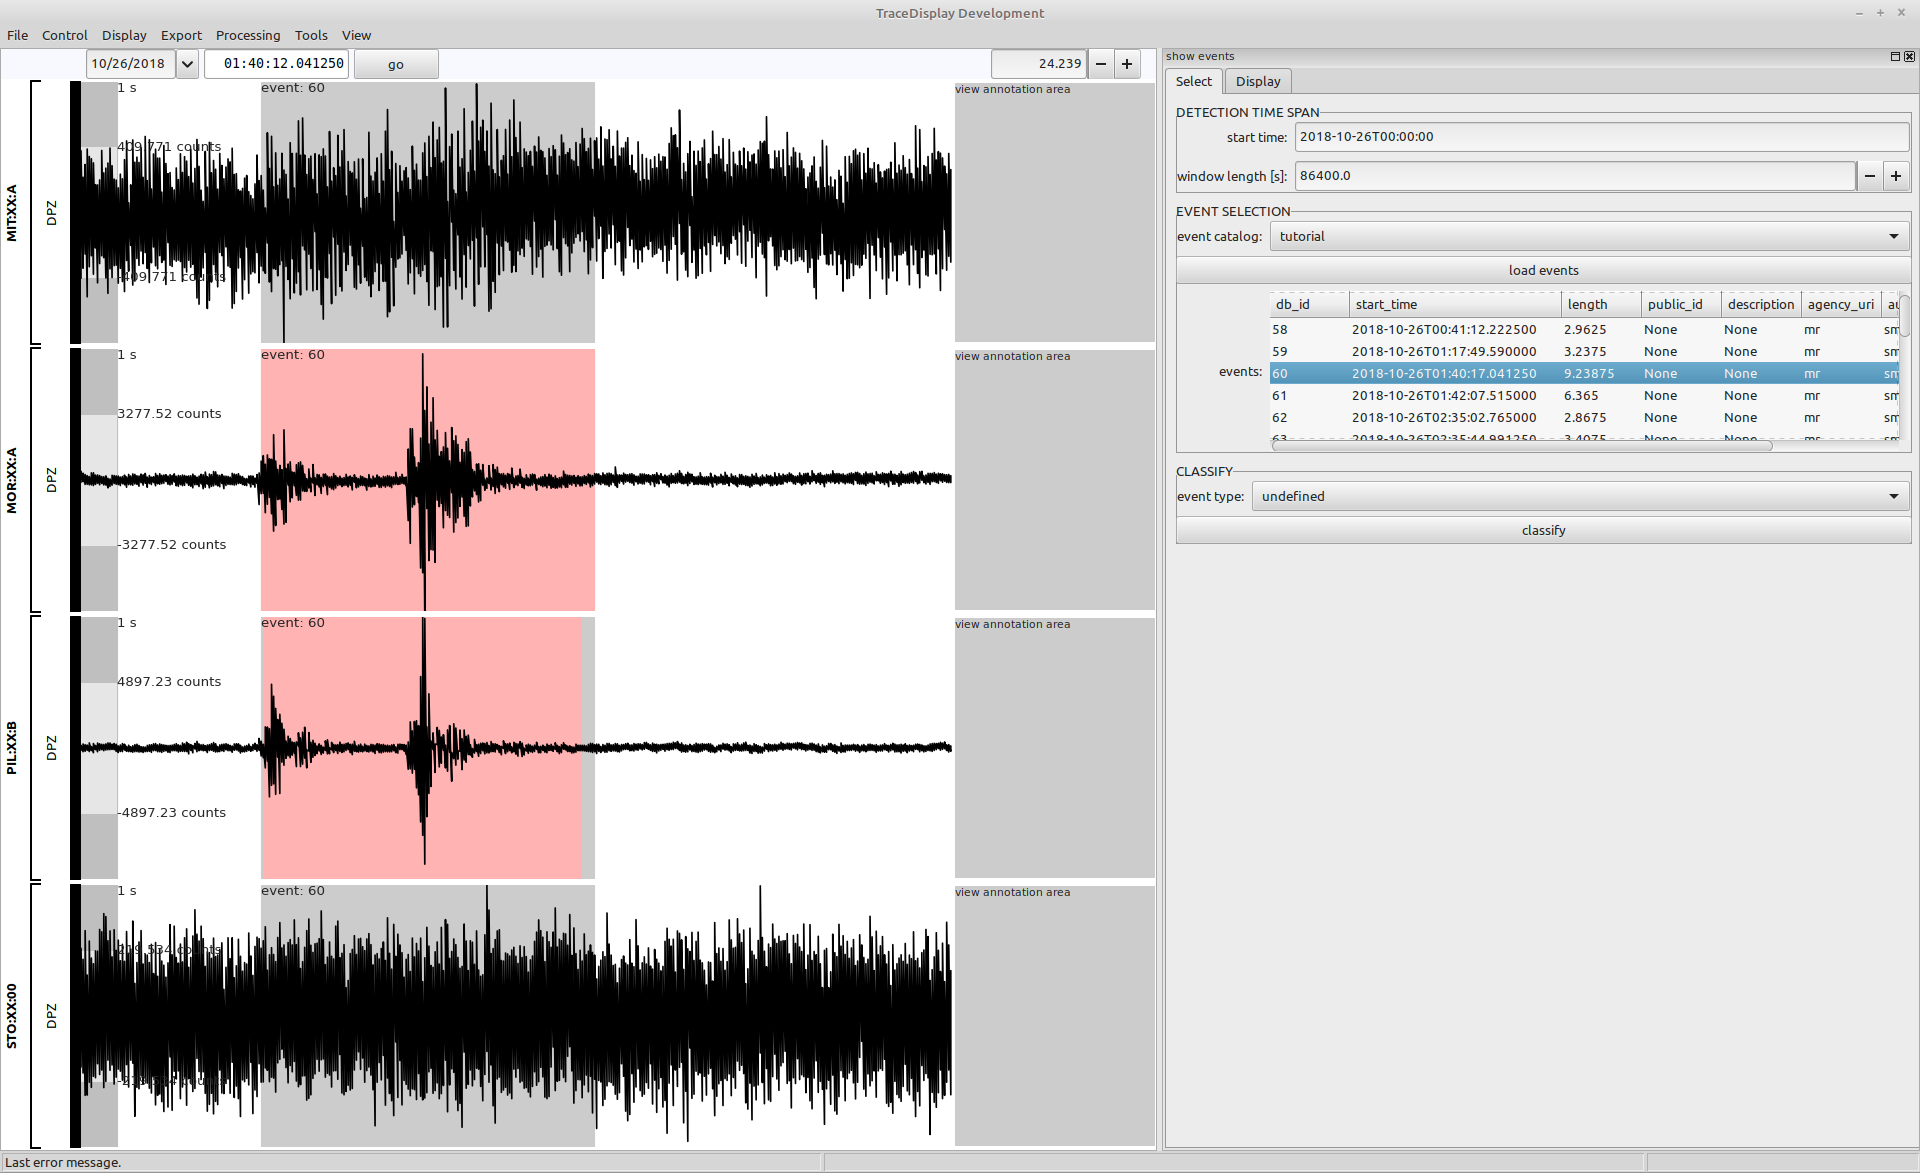
Another interesting event is the event with the start time 2018-10-26T01:40:17. To view this event change the start time in the event selector to 2018-10-26T00:00:00 and click the load events button to reload the events. Then select the event with id 60 and start time 2018-10-26T01:40:17.041250 to show the event data.
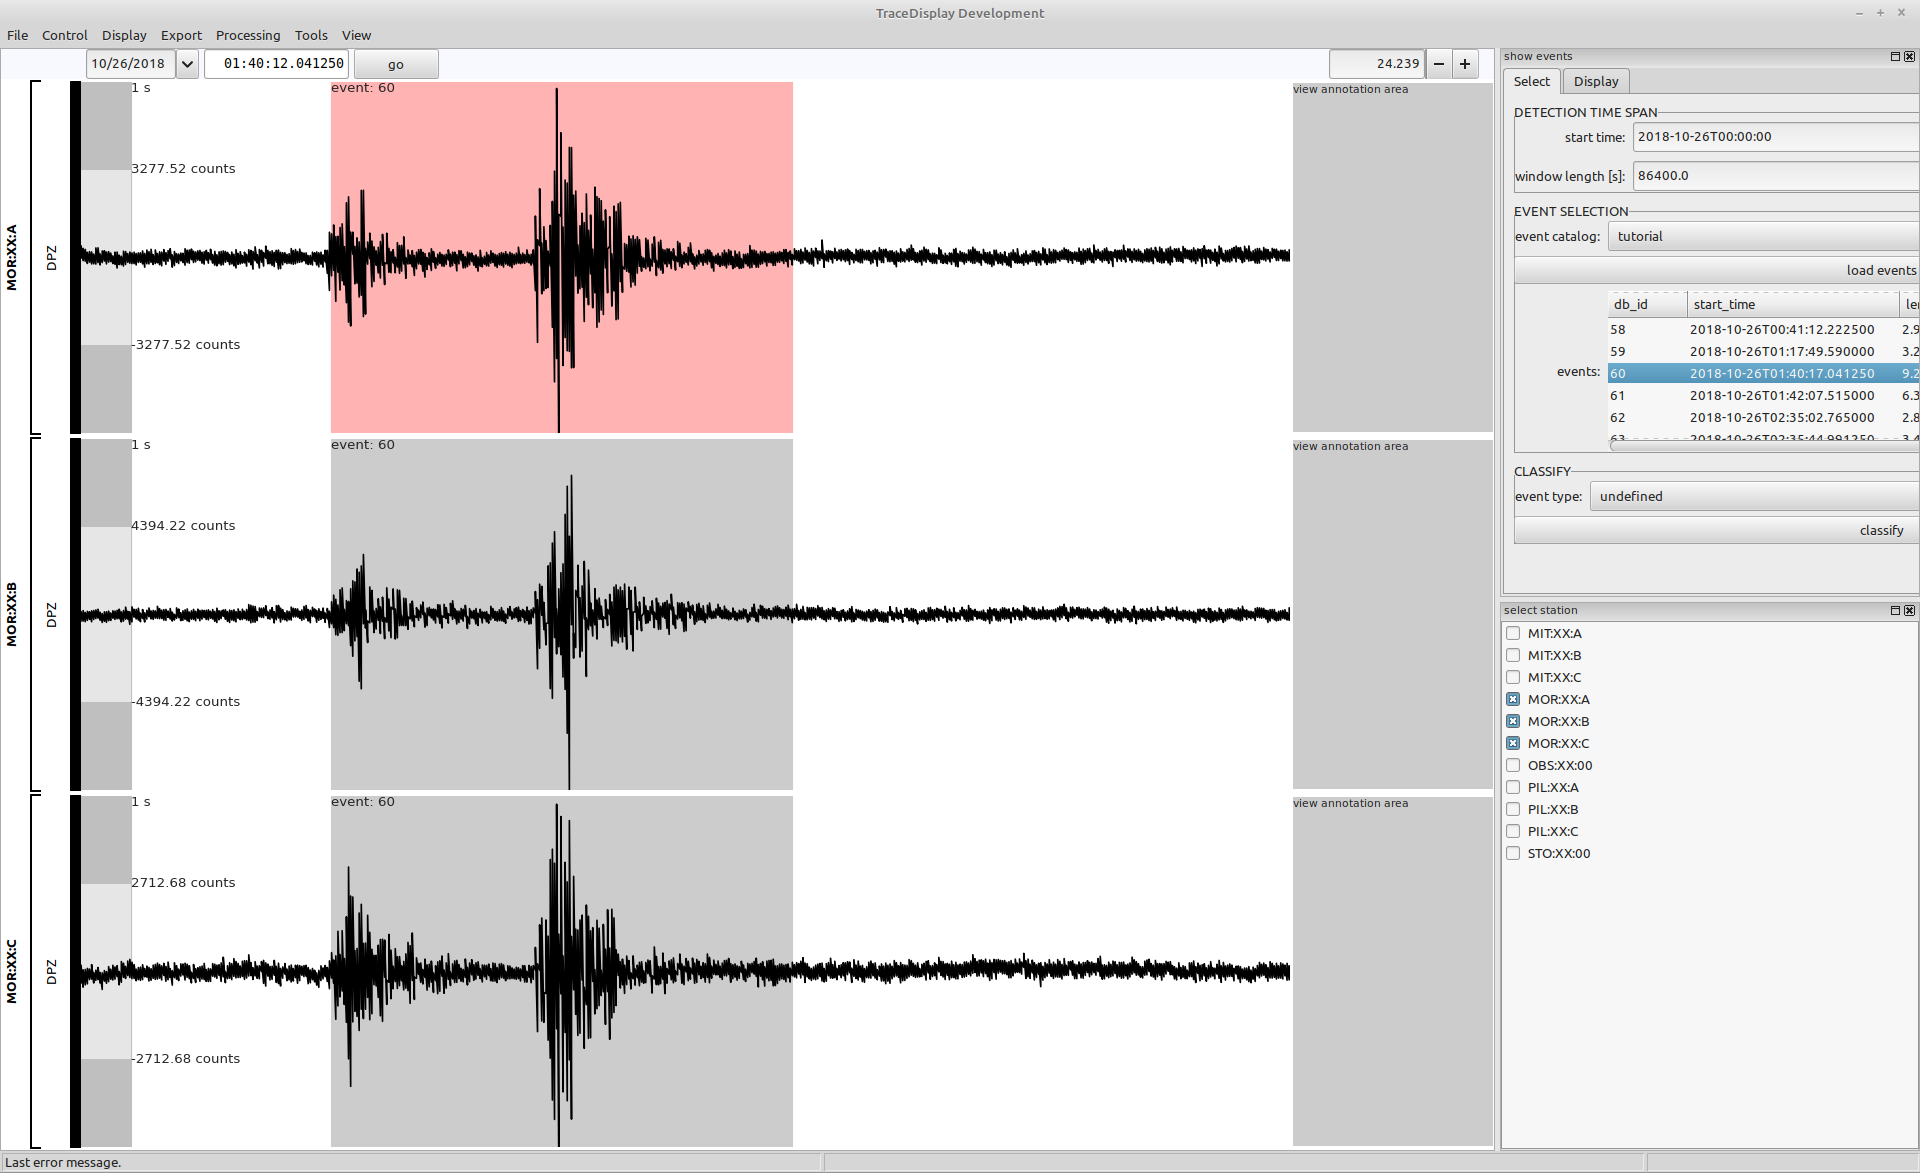
This event is an interesting event recorded on the arrays MOR and PIL. To investigate the event on one array, open the station selector plugin by clicking the menu Display->select station and then selecting the stations MOR:XX:A, MOR:XX:B and MOR:XX:C in the event selector docking frame. Resize the docking frame to create more space for the data views.
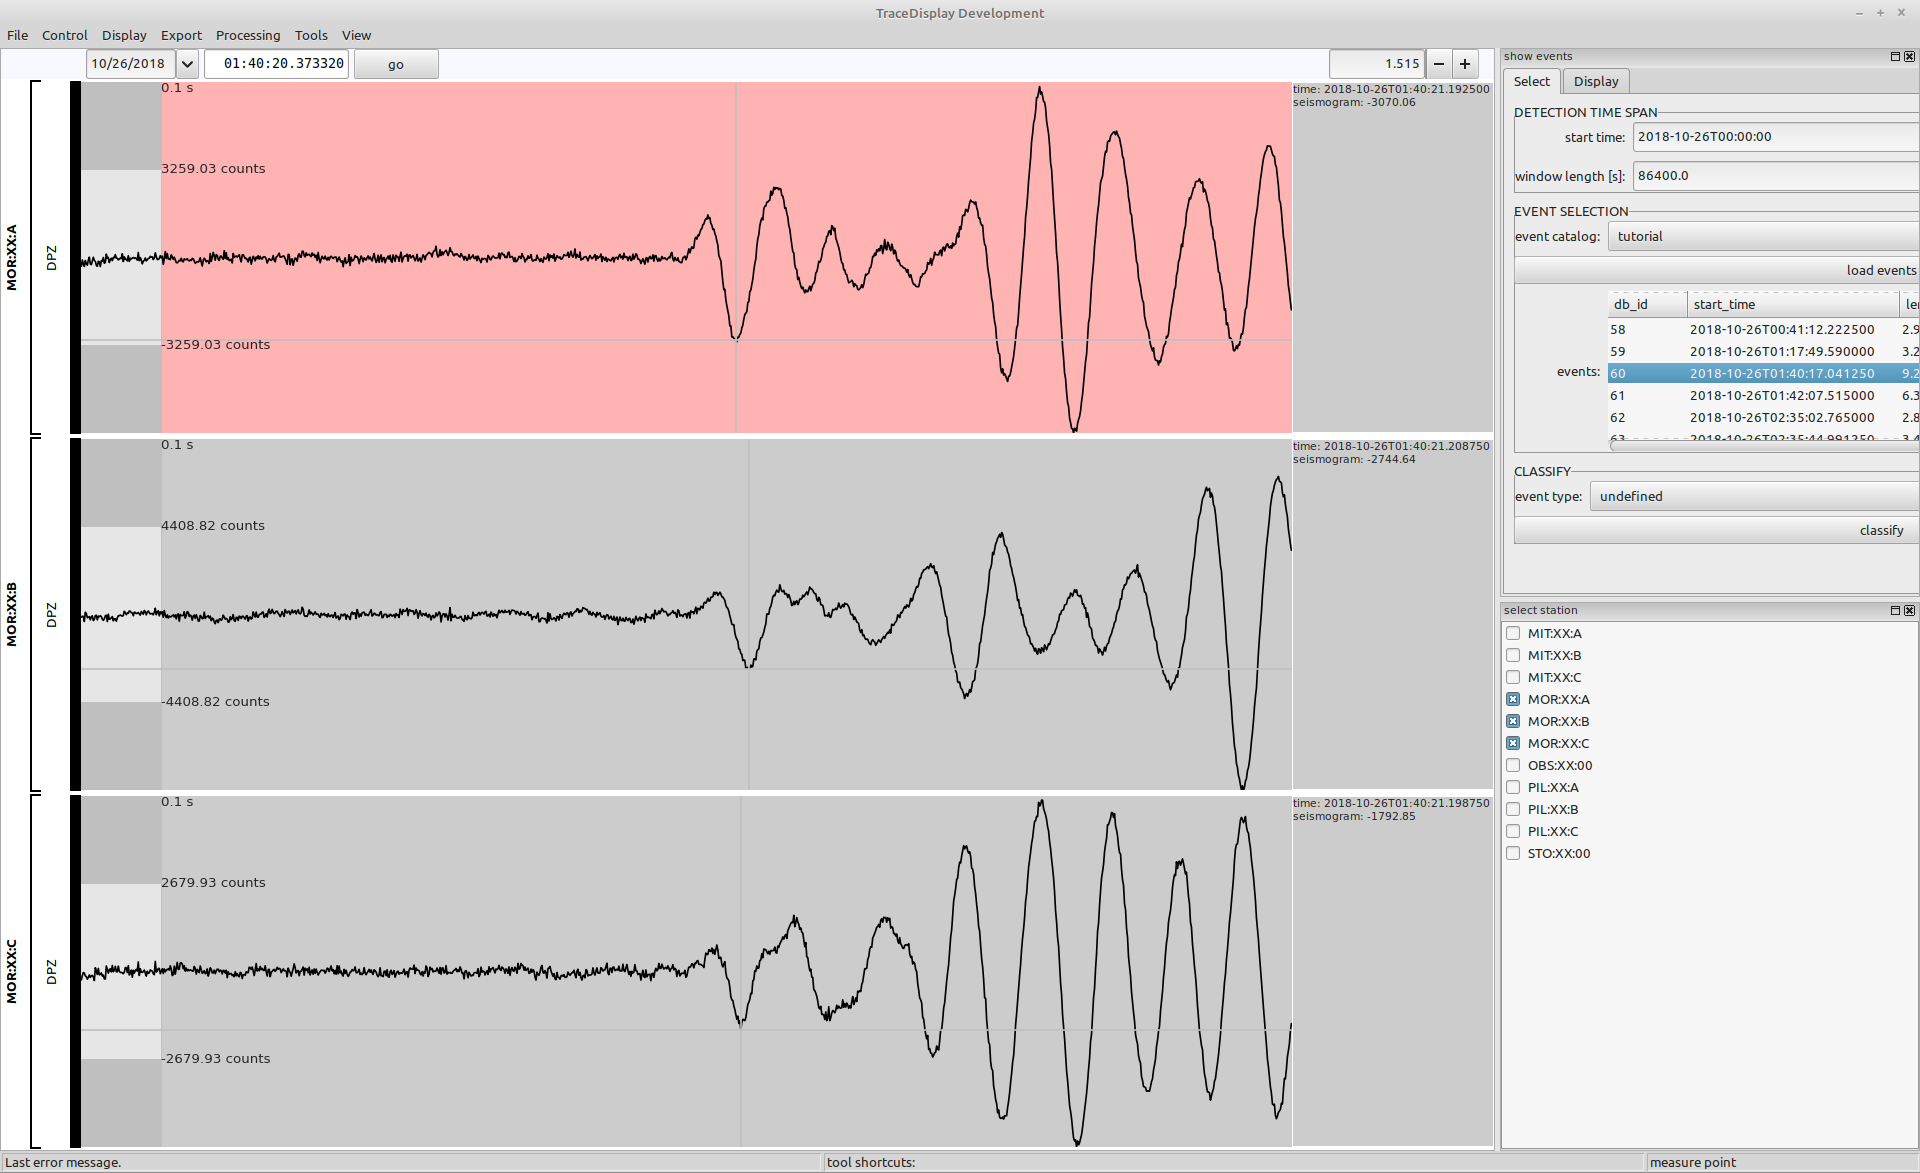
This events looks like a rockfall candidate. Zoom in using the + key and navigate to the onset of the second, stronger signal of the event. One can see the differences of the arrival times of the waveform at the three array locations. Use the measure tool (shortcut M of menu Tools->measure point) to better highlight the time differences. Click and drag the mouse in the seismogram view to move the measure pointer. The data values are plotted in the view annotation area on the right side of the views.

Copyright © 2022 Stefan Mertl.
This article is licensed under a Creative Commons Attribution-ShareAlike 4.0 International license.
You are allowed to share the material, that means to copy and redistribute the material in any medium or format as long as you give appropriate credit to the creator and add the link to the license. You are allowed to adapt, that means to remix, transform, and build upon the material. If you adapt the material, you must distribute your contributions under the same license as the original.
If possible, please cite this article using the following form:
Psysmon Documentation, Sonnblick Events, "Visual event check", Stefan Mertl, 2022-08-27, www.mertl-research.at, licensed under CC BY-SA 4.0