Interactive determination of optimal STA/LTA parameters.
STA/LTA parameters
On this page
When using the short term average/long term average (STA/LTA) method for signal detection, a tuning of the detection parameters is needed. This tuning sometimes becomes a kind of magical process because the effects of changing a certain parameter is not always obviously reflected in the resulting detections. In psysmon, the impact of the parameter tuning can be interactively assessed using the tracedisplay. All relevant timeseries used in the STA/LTA detection can be visualized together with the seismograms or other views of the timeseries. This makes the adaption of the STA/LTA parameters to the custom needs much easier and transparent.
The STA/LTA algorithm implemented in psysmon basically follows the algorithm introduced by Rex Allen [1] with some adaptions. For the computation of the stop value, a custom algorithm is used. After a valid signal detection, the effect of the signal on the LTA is removed to enable the detection of closely spaced events, which would otherwise be missed due to an elevated LTA.
An introduction to tuning an STA/LTA trigger is given by Amadej Trnkoczy [2] in the New Manual of Seismological Observatory Practice 2 (NMSOP-2) [3].
Open the display collection
Load the display collection that we have created when screening the data.
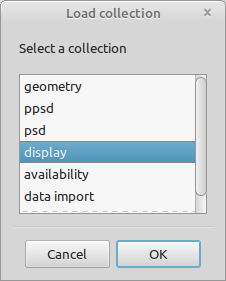
Open the context menu of the collection listbox by clicking the right mouse button somewhere in the collection listbox. Select the menu entry load collection to open the load collection dialog.
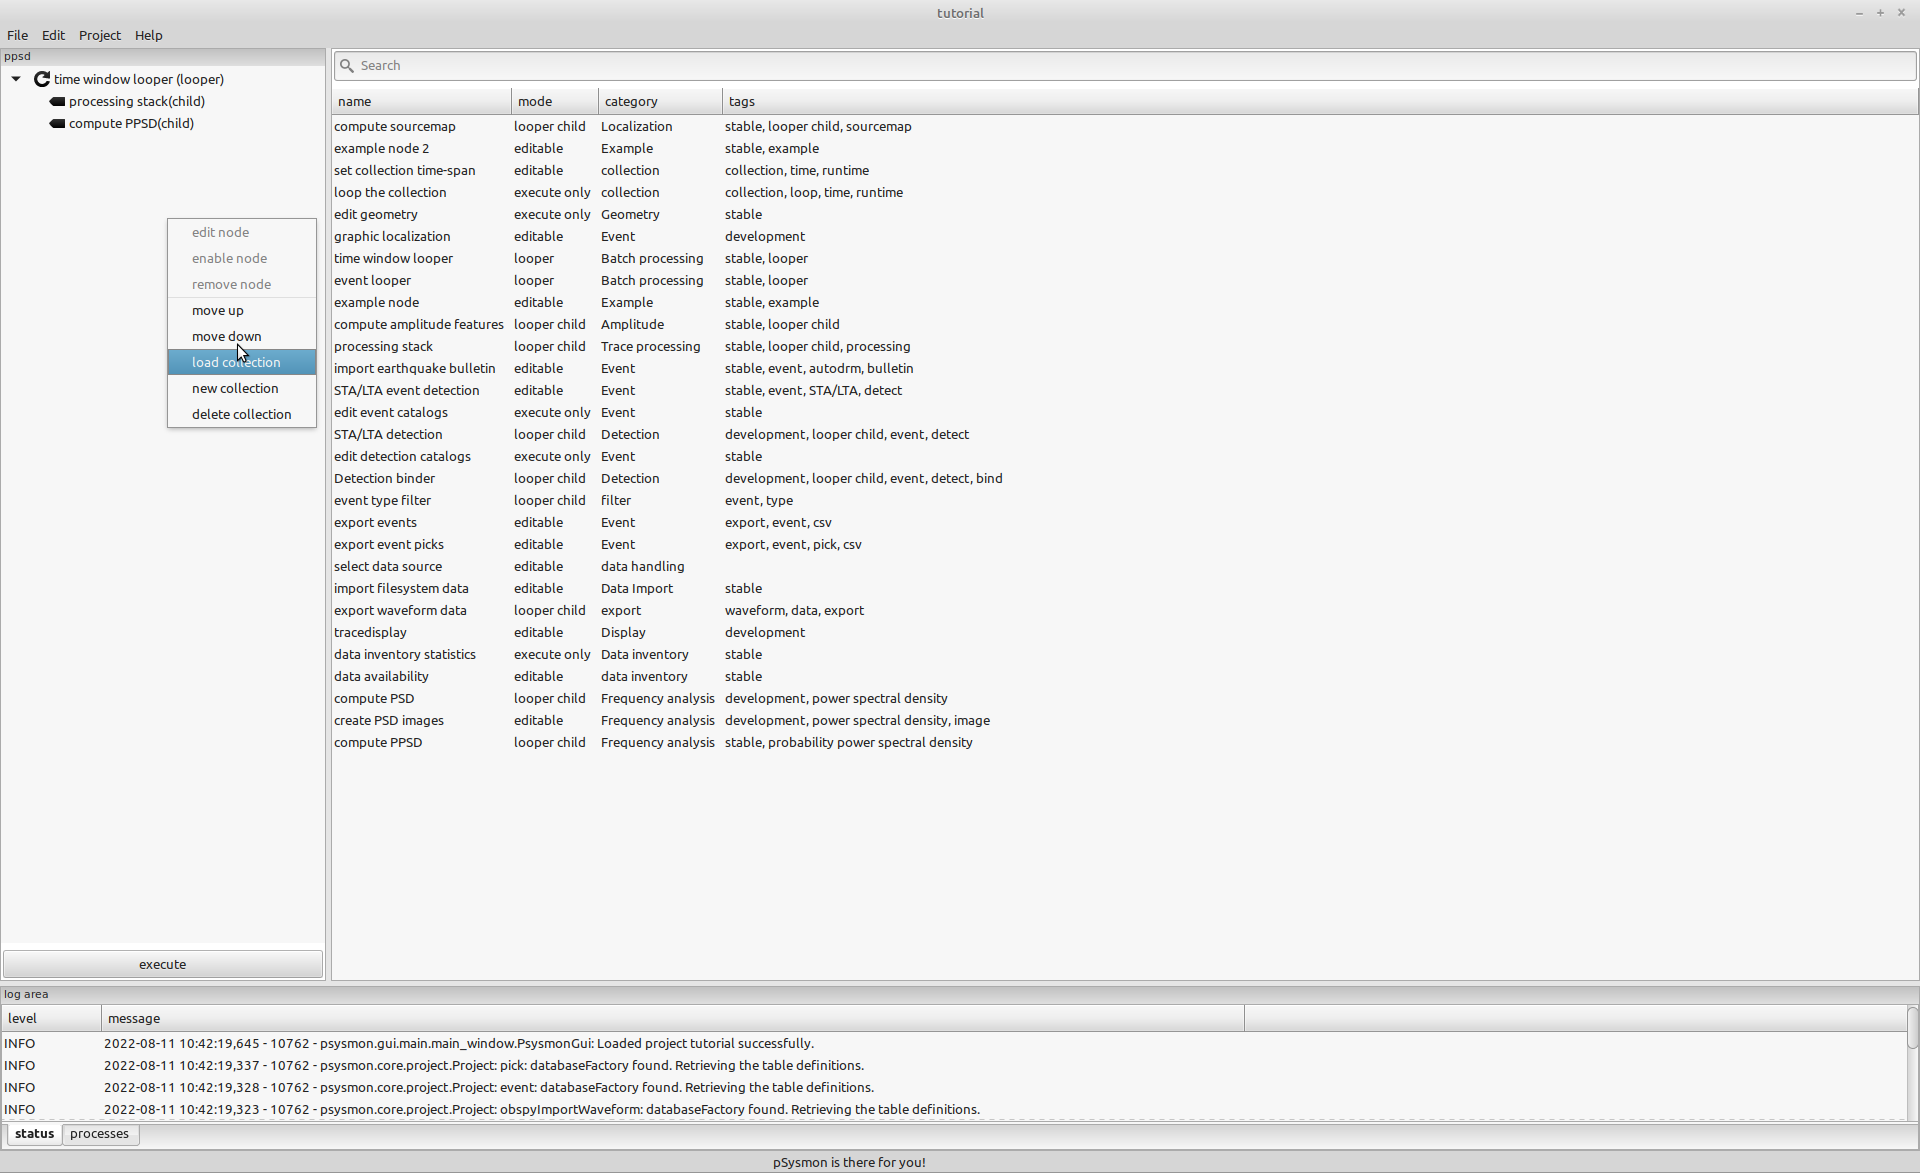
Select the display collection in the load collection dialog and click the OK button to load the collection.
The selected collection is shown in the psysmon main window.
Open the tracedisplay window
The preferences of the tracedisplay collection node are stored in the collection. They should be the same as defined in the chapter about screening the data. Execute the collection using the execute button to open the tracedisplay window.
Set the display range
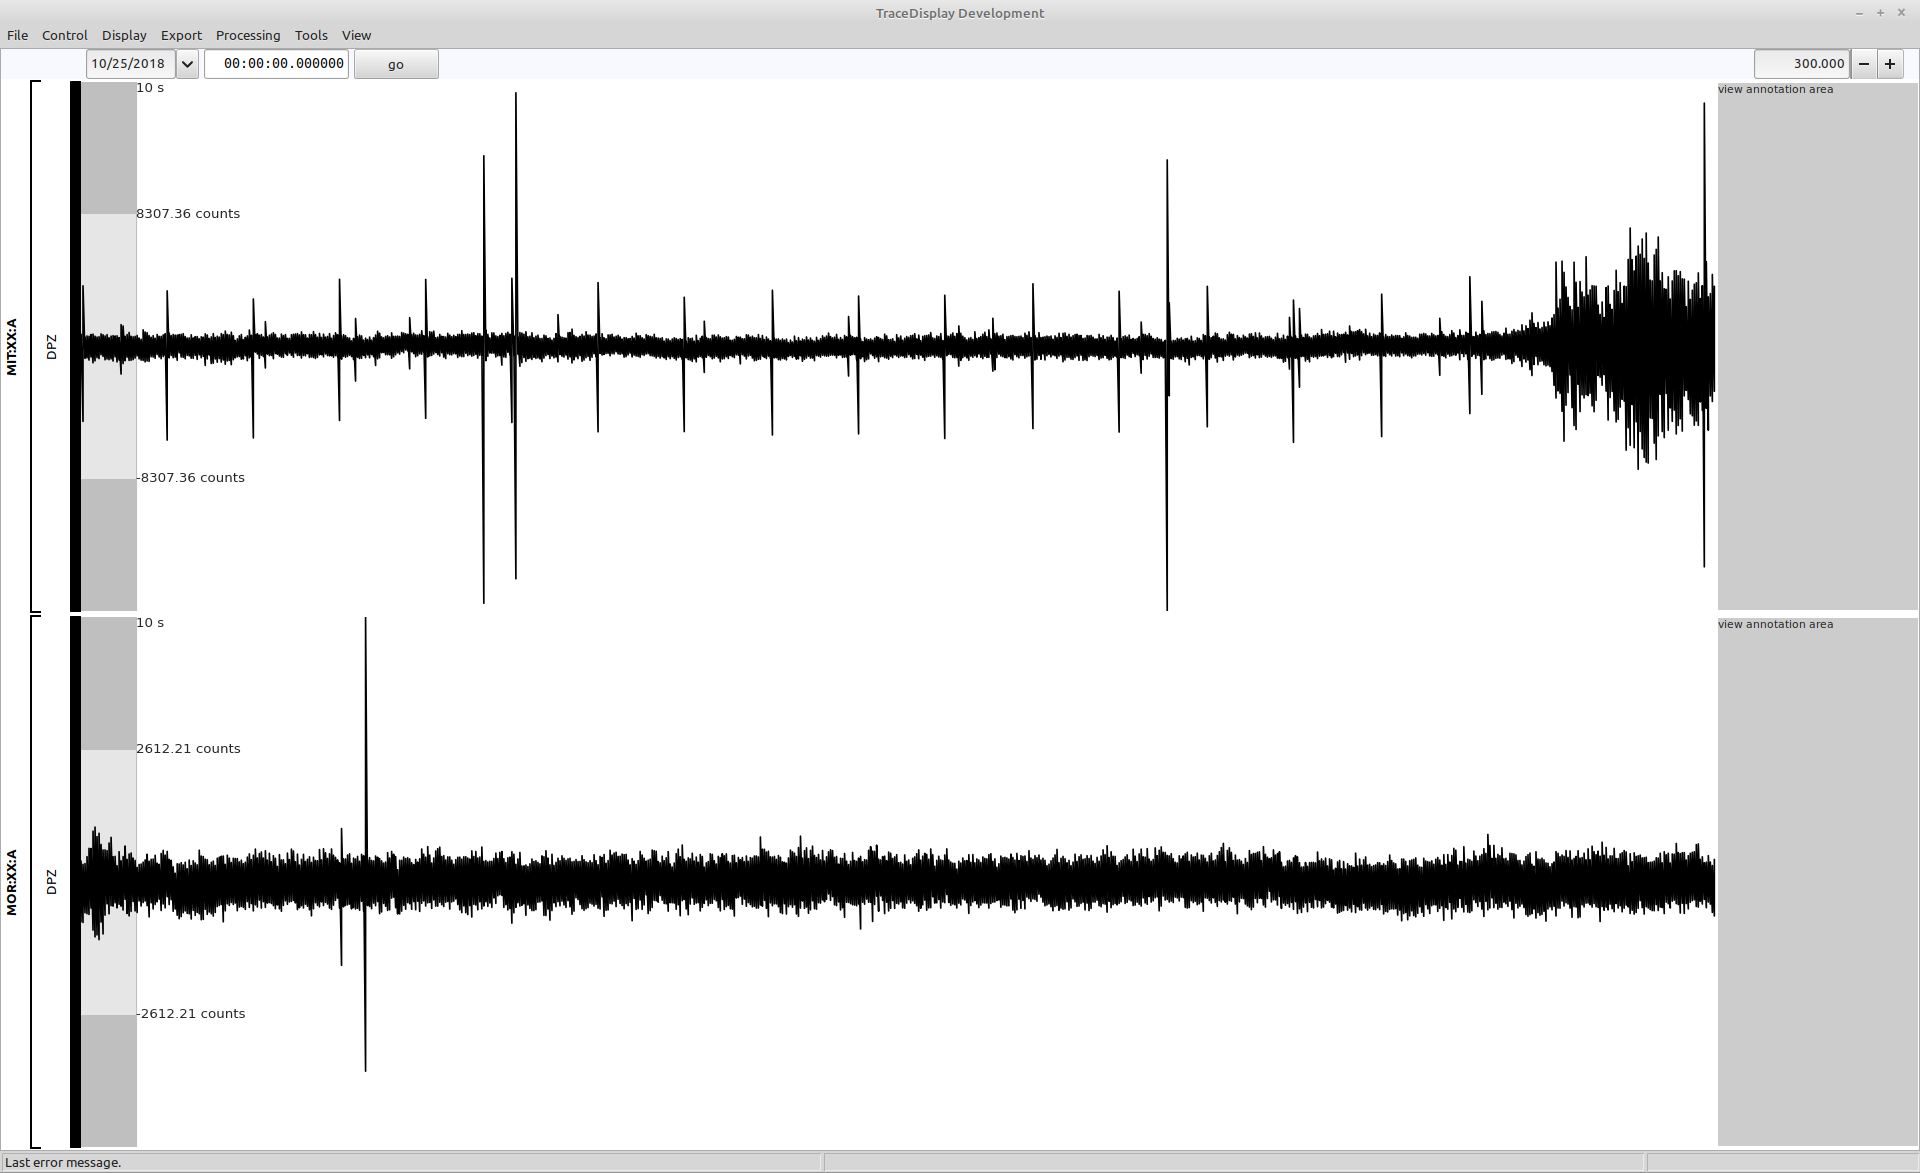
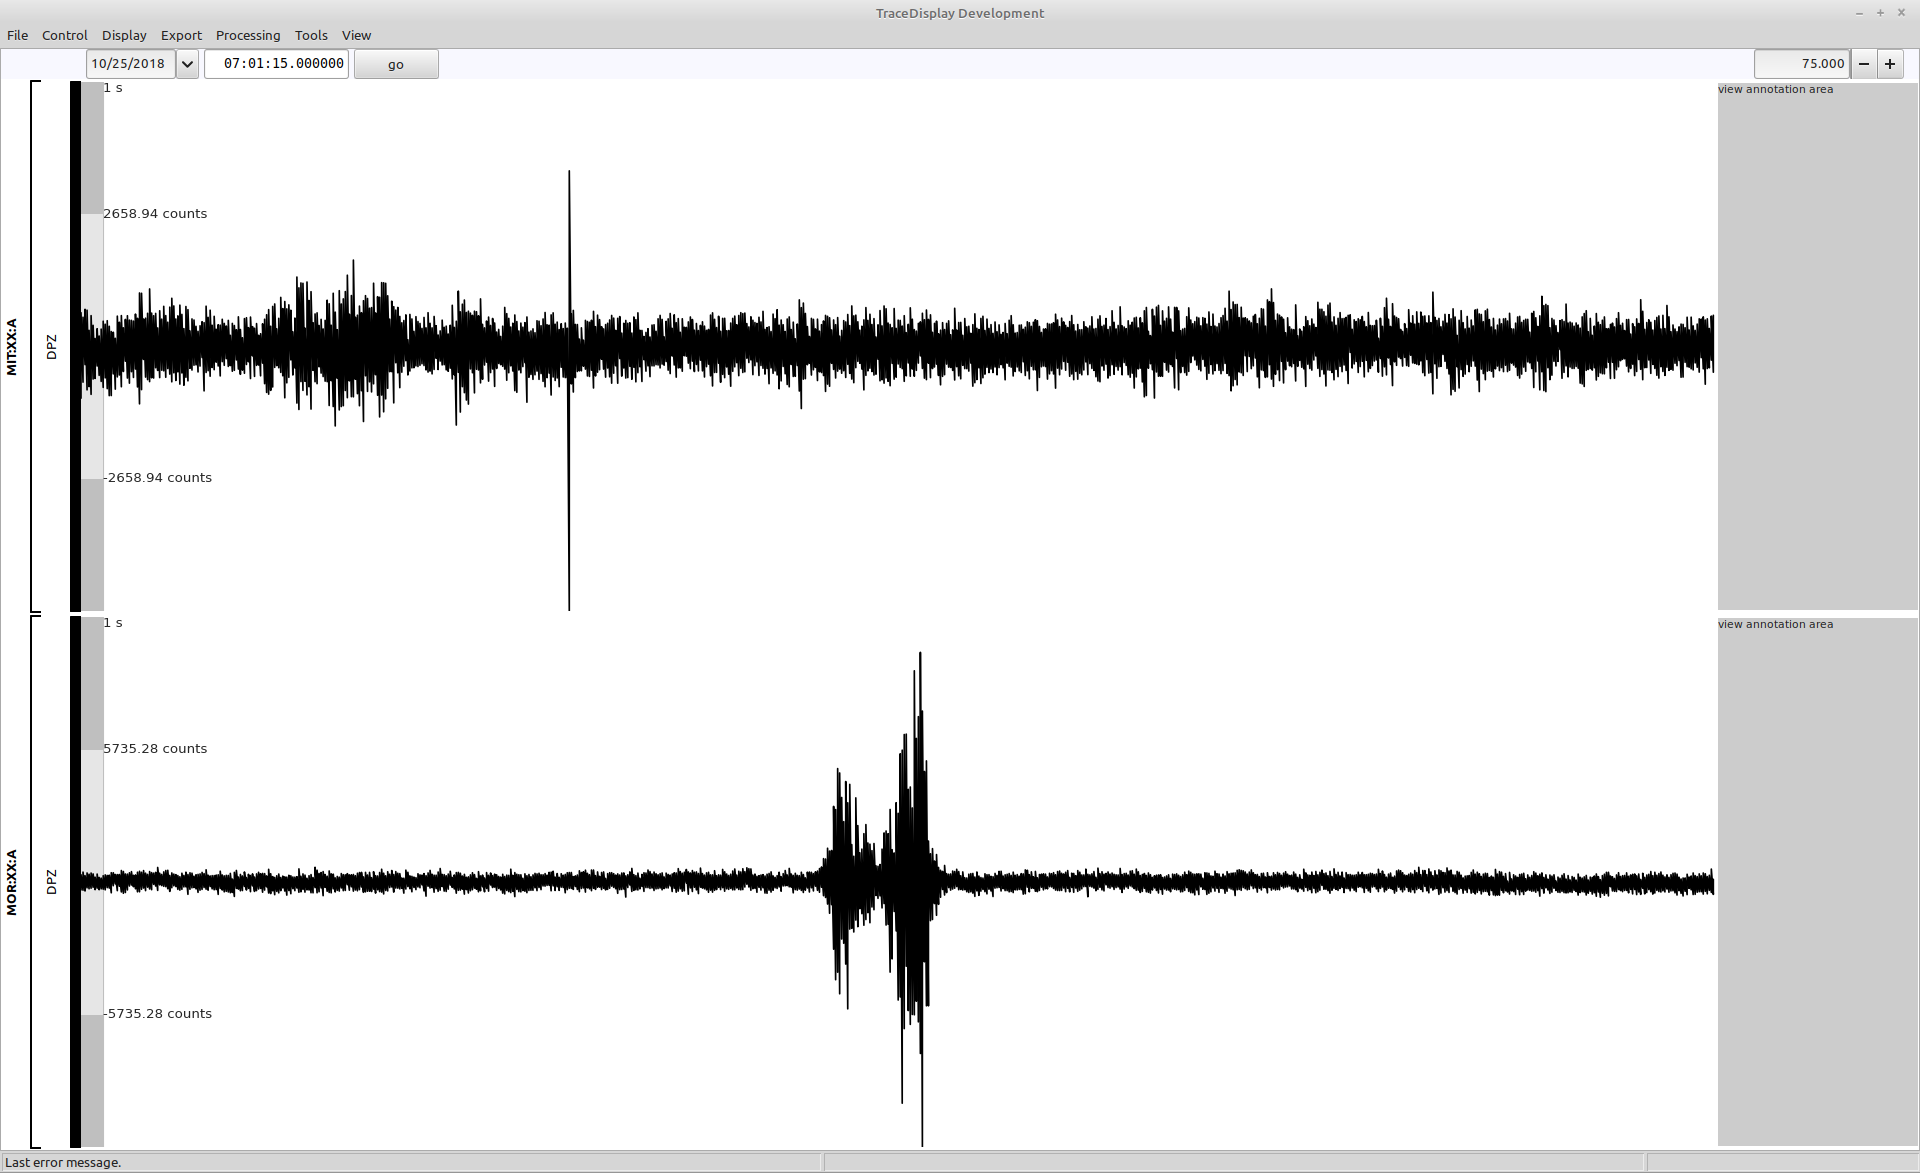
Use the datetime and duration controls to set the time range to 2018-10-25 07:01:15.000000 with a duratin of 75 seconds. You should see a signal at station MOR.
Show the STA/LTA detection
Use the CTRL+D shortcut to show the STA/LTA detection view and the ALT-D shortcut to show the STA/LTA detection preferences. You can find descriptions of the parameters in their tooltips. To show a tooltip hover the mouse pointer over the desired parameter edit field.
Check if the default values in the opened preferences dialog fit the following parameters, adjust them if necessary.
| parameter | value |
|---|---|
| cf type | square |
| STA length | 1.0 |
| LTA length | 5.0 |
| Threshold | 3.0 |
| Fine threshold | 2.0 |
| turn limit | 0.05 |
| stop grow ratio | 0.001 |
| stop grow exponent | 1.0 |
| stop grow increase | 0.001 |
| stop grow inc. begin | 10.0 |
| stop delay | 0.1 |
| reject length | 0.5 |
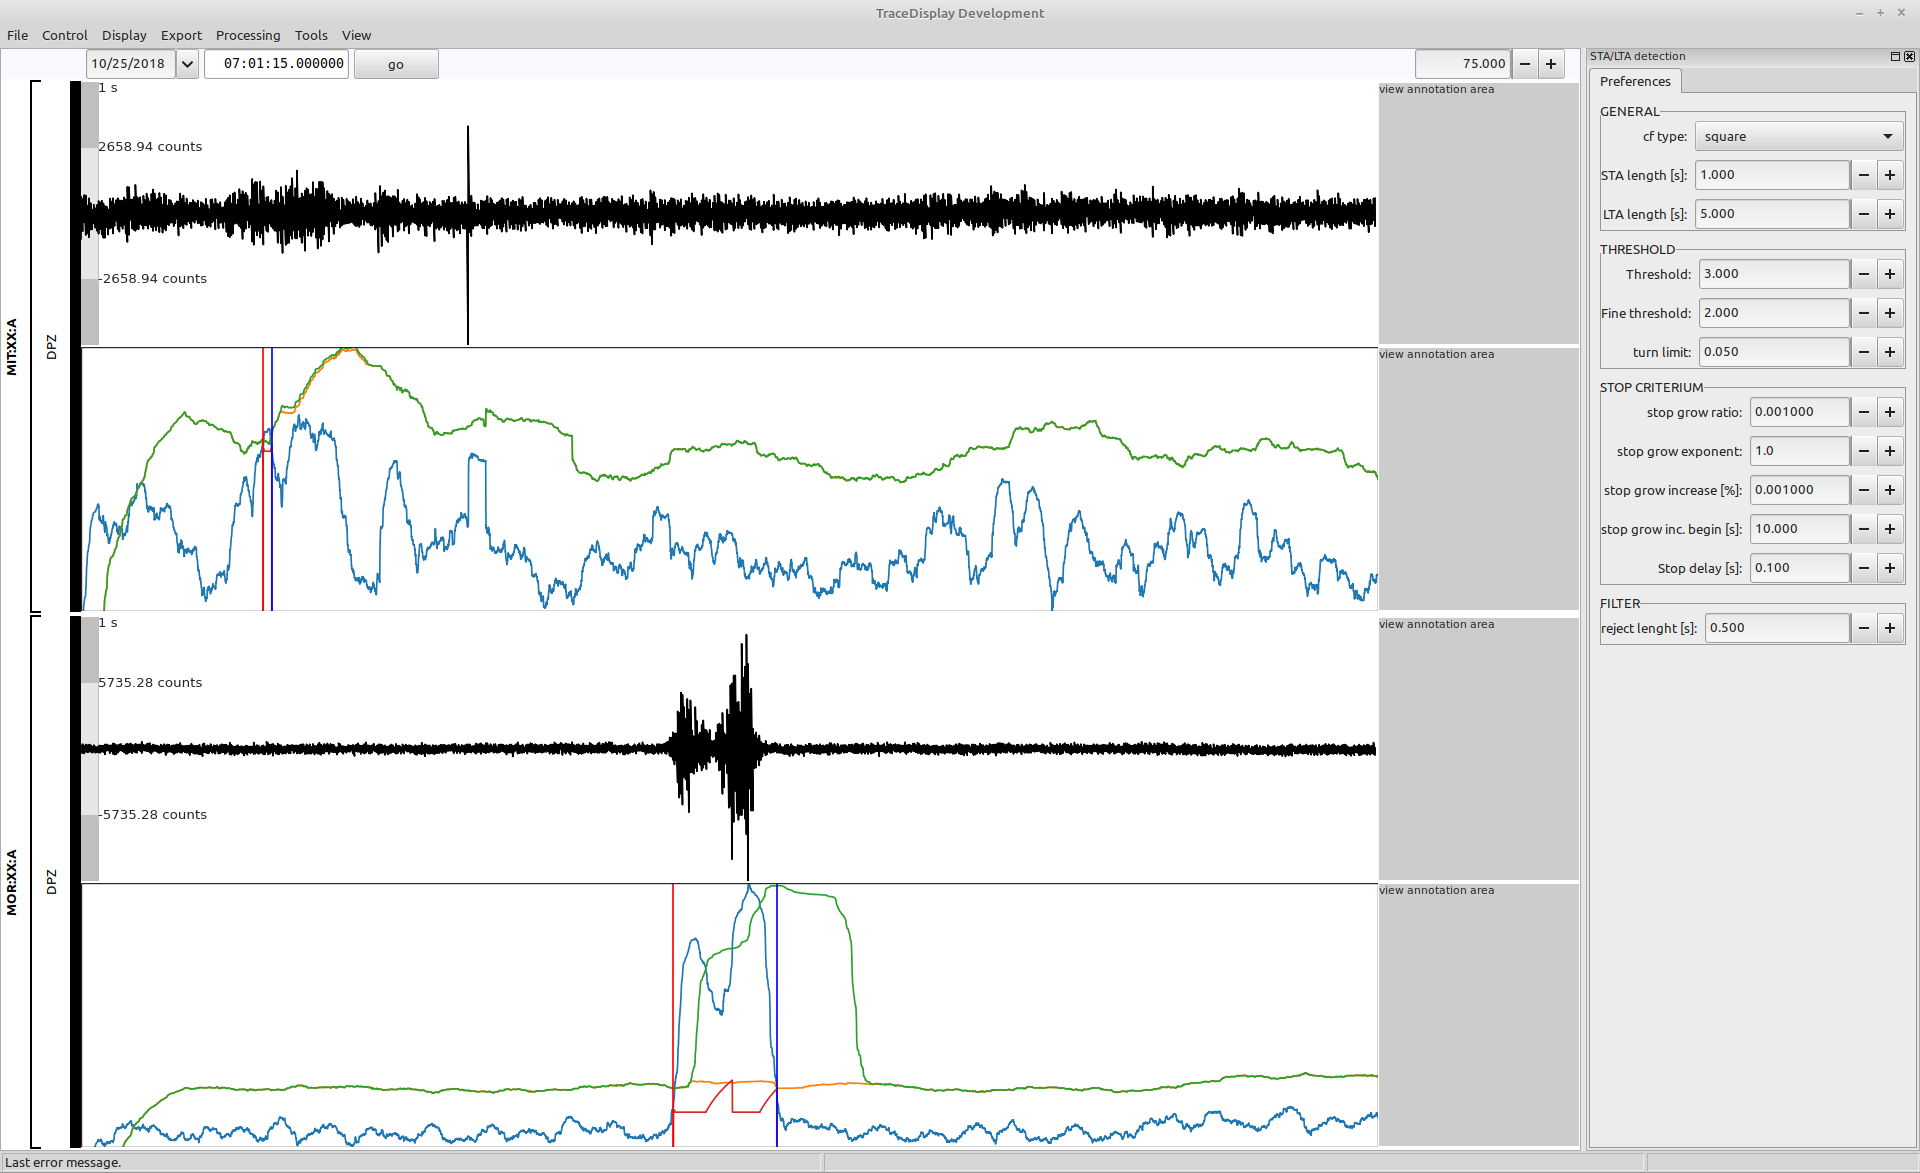
The STA/LTA curves
The shown event on station MOR is a good example to explain the various lines shown in the STA/LTA detection view.
- green line
- The threshold function (THRF), which is the long term average multiplied by the Threshold value.
- blue line
- The short term average computed using the characteristic function (e.g. square) and the STA length. A signal start is declared when the STA goes above the threshold function.
- dark red line
- The stop value. If a signal start has been detected, the stop value starts to grow every time the STA falls below the THRF. It is reset when the STA goes above the THRF again. A signal end is declared when the STA falls below the stop value. How fast the stop value grows is determined by the parameters of the stop criterium section in the preferences.
- orange line
- The threshold function cleaned from the effects of the detected signals.
- vertical red line
- The start of a detected signal.
- vertical blue line
- The end of a detected signal.
Change the parameters in the STA/LTA detection preferences panel to get a feeling how these parameters change the behaviour of the detection result. Once you are satisfied with the detection results, you can navigate through the data to check how the detector responds to other events or to random noise.
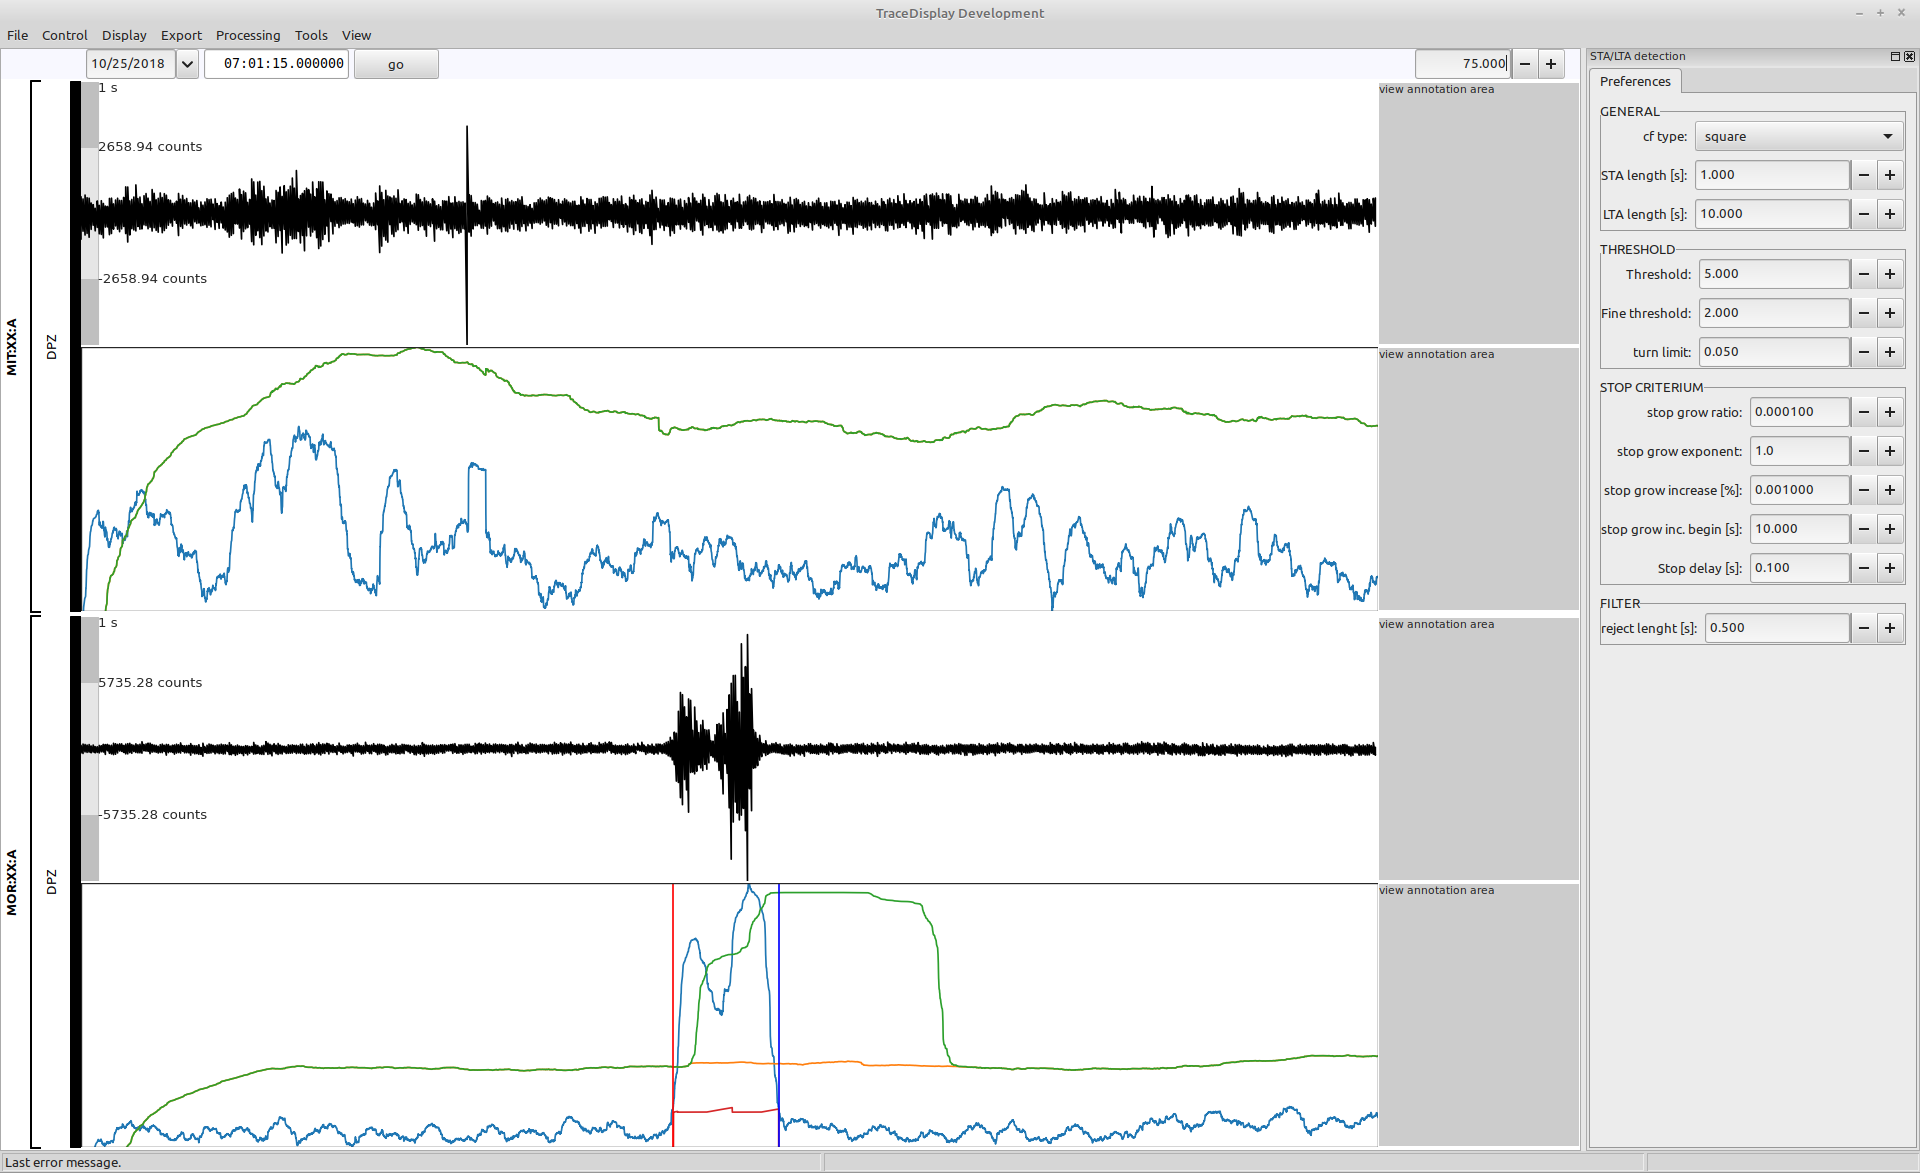
Adjust the detection parameters
Increase the LTA lenght to 10.0 to let the THRF be less reactive to short-time amplitude changes. Change the Threshold to 5 to make the detector less sensitive to weak events. and set the stop growth ratio to 0.0001 to prevent a too fast splitting of signals with varying amplitude envelope. Use the R shortcut to refresh the views to make the changes visible. If the shortcut doesn’t seem to work, click in the views area to reset the window focus. When editing preferences, the shortcuts are not active.
You should see, that the detection on station MIT vanished due to the increase of the threshold value and that the stop value grows more slowly.
Performance with earthquake signal
The used STA/LTA detection values fit quite well for the detection of short signals which is the focus of this tutorial. To show the performance of these detection parameters for earthquake signals set the displayed time span to 2018-10-25T22:52:00.000000 with a duration of 900 seconds.
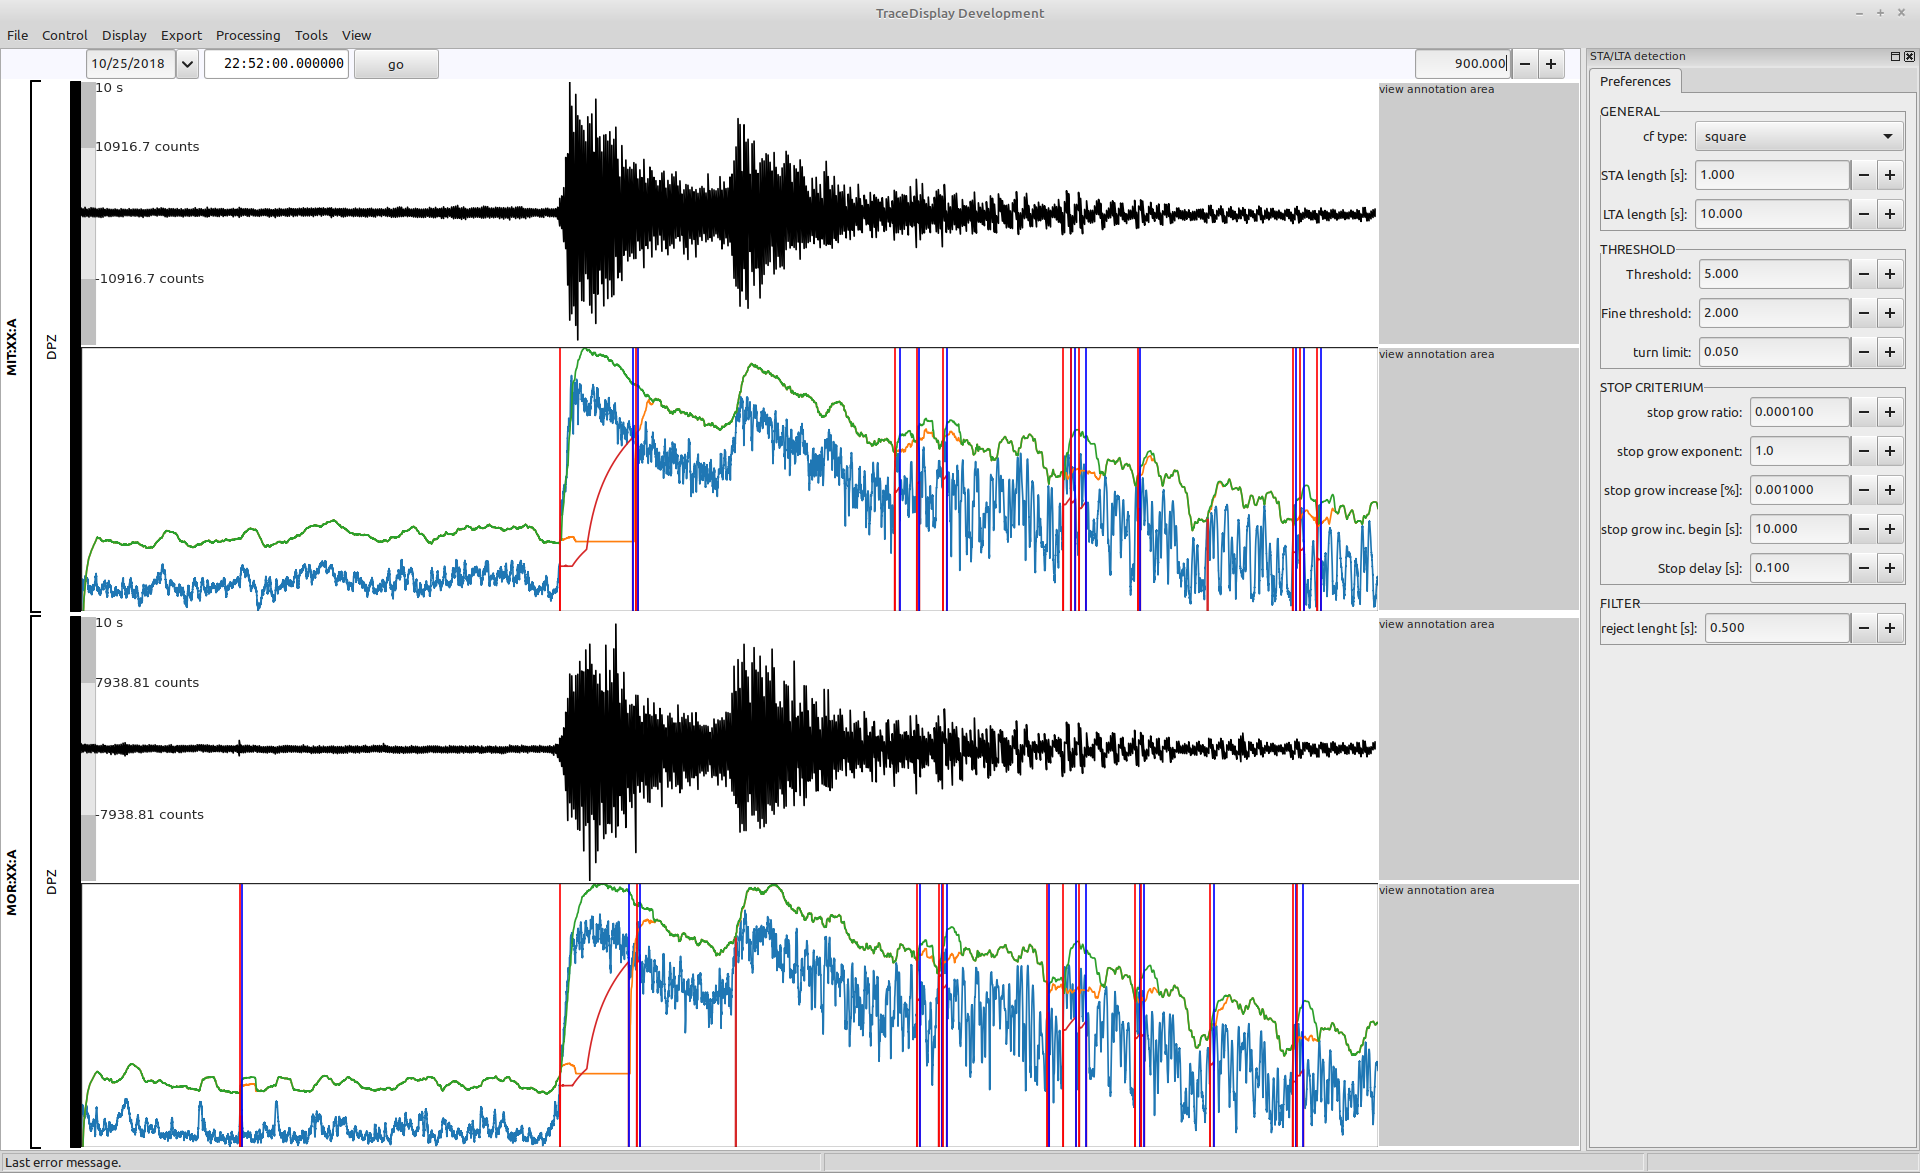
You can see, that the signal is not detected as expected. The parameters which are good to detect short, and potentially closely-spaced successive events is not performing well with long earthquake signals. To focus on the detection of earthquake signals, the parameter would have to be adjusted so that the individual phases of the earthquake are not split into individual signals. Finding detection parameters that fit all types of input signals perfectly is not possible, because at some point in the detection process signal becomes noise and vice versa [4]. It is important to know in advance on which signal type to focus, and then find the best compromise to detect as many other signal types as possible without decreasing the detection performance for the wanted signal types.
Tweaking the parameters
Change some of the parameters to get a better detection of the earthquake signal. From the detection curves it can be seen, that the problem is the fast increasing stop value (dark red line) which triggers an early signal end. Increase the LTA length to make it less sensitive to short amplitude changes. Additionlly, decrease the growing of the stop value by changing the stop grow exponent, the stop grow increase and the stop grow inc. begin. Furthermore, add a 100 Hz lowpass filter using the processing stack to filter short-term signals.
The new detection parameters are:
| parameter | value |
|---|---|
| cf type | square |
| STA length | 1.0 |
| LTA length | 20.0 |
| Threshold | 5.0 |
| Fine threshold | 2.0 |
| turn limit | 0.05 |
| stop grow ratio | 0.0001 |
| stop grow exponent | 0.9 |
| stop grow increase | 0.0001 |
| stop grow inc. begin | 200.0 |
| stop delay | 0.1 |
| reject length | 0.5 |
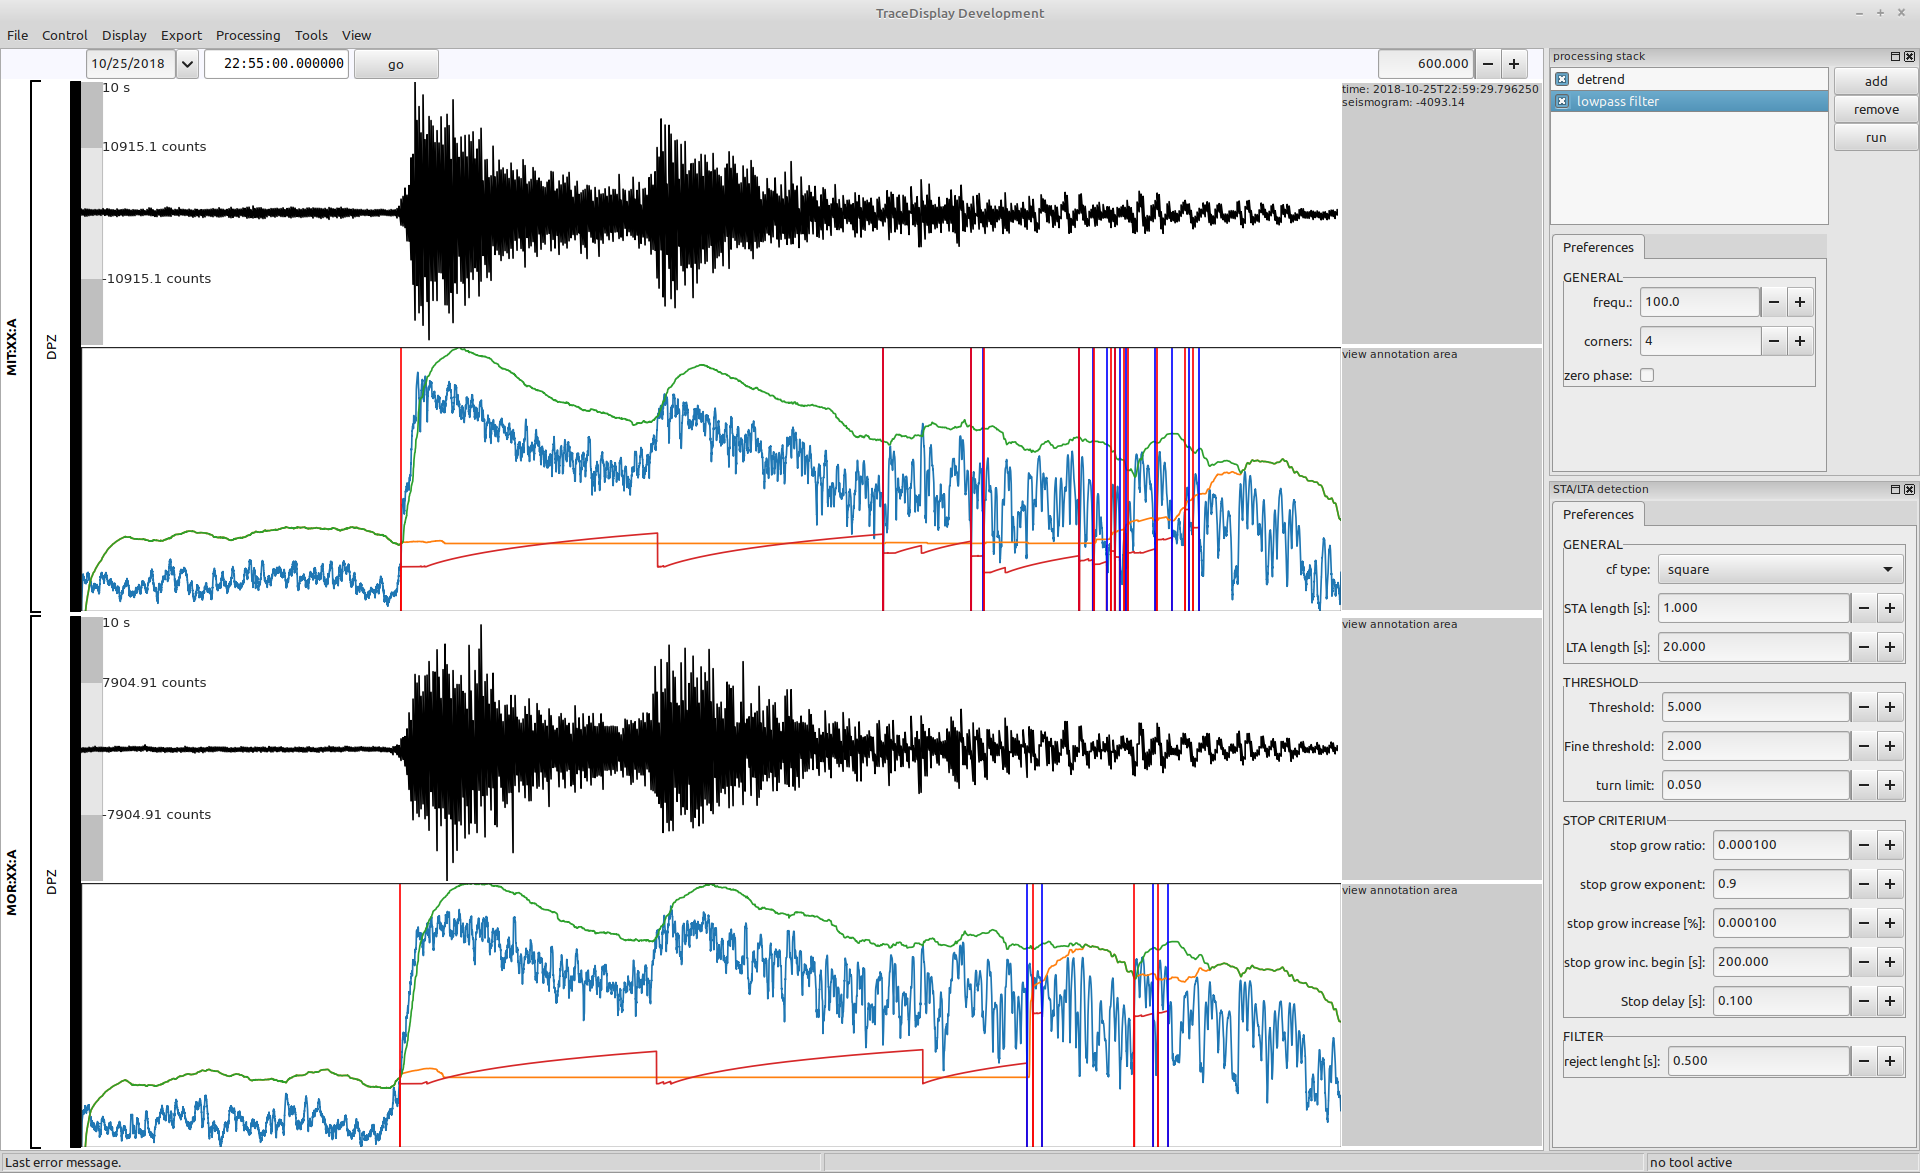
The detection of the earthquake has significantly improved by covering the P- and S-phase signals into one detection. There are still quite many short duration detections after the earthquake, but this will most likely be ignored by the upcoming detection binding process.
Now check if the detection of the short signalf found at staition MOR at 2018-10-25 07:01:15.000000 has not been degraded by changing the detection parameters.

The result is looking good, thus, the parameters seem to be a good choice for our data and detection goals.
References
- R. Allen, “Automatic earthquake recognition and timing from single traces,” Bulletin of the Seismological Society of America, vol. 68, no. 5, pp. 1521–1532–, 1978.
- A. Trnkoczy, “Understanding and parameter setting of STA/LTA trigger algorithm,” New Manual of Seismological Observatory Practice 2 (NMSOP-2), pp. 1–20, 2012.https://gfzpublic.gfz-potsdam.de/pubman/faces/ViewItemOverviewPage.jsp?itemId=item_43337
- P. Bormann, “New Manual of Seismological Observatory Practice (NMSOP-2),” New Manual of Seismological Observatory Practice 2 (NMSOP2), 2012.http://doi.org/10.2312/GFZ.NMSOP-2 https://nmsop.gfz-potsdam.de
- J. A. Scales and R. Snieder, “What is noise?,” Geophysics, vol. 63, no. 4, pp. 1122–1124, 1998.

Copyright © 2022 Stefan Mertl.
This article is licensed under a Creative Commons Attribution-ShareAlike 4.0 International license.
You are allowed to share the material, that means to copy and redistribute the material in any medium or format as long as you give appropriate credit to the creator and add the link to the license. You are allowed to adapt, that means to remix, transform, and build upon the material. If you adapt the material, you must distribute your contributions under the same license as the original.
If possible, please cite this article using the following form:
Psysmon Documentation, Sonnblick Events, "STA/LTA parameters", Stefan Mertl, 2022-08-27, www.mertl-research.at, licensed under CC BY-SA 4.0