Content of the tutorial
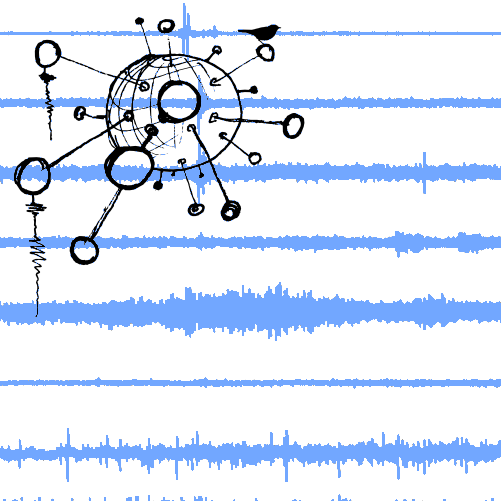
Sonnblick Events
This tutorial covers the complete workflow from installing psysmon and importing a seismic dataset all the way to the detection of seismic events. The tutorial was requested and funded by the Zentralanstalt für Meteorologie und Geodynamik to document the data processing of the seismic monitoring network installed the mount Hoher Sonnblick, Austria.
The creation of this tutorial was supported by ZAMG.
Getting started
Here all steps needed to install and start psysmon are described. The creation of a virtual environment, the required packages, the installation of psysmon from the github source code and the setup of the database for psysmon are explained.
Project creation
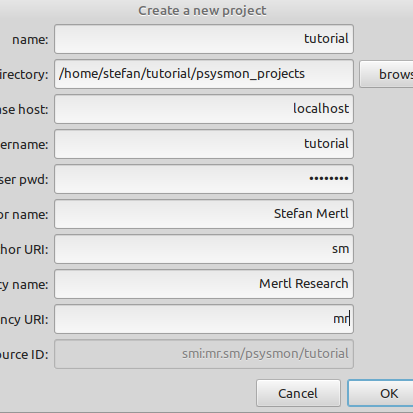
The initial steps to work with psysmon ist the creation of a project. psysmon uses a database to store data. Therefore the database has to be setup properly so that psysmon can create the needed database tables.
Geometry file
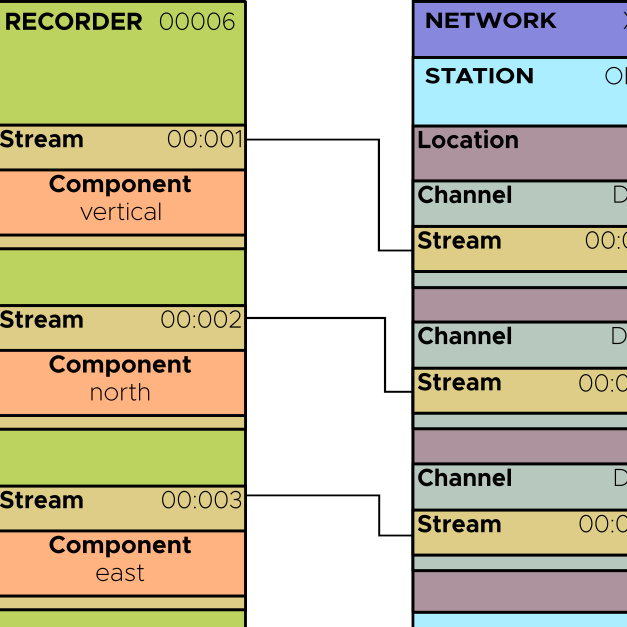
The geometry XML file contains the inventory and layout of the seismic network. It contains sensors, recorders and stations and the assignment of sensors to recorders and recorders to stations.
Import geometry file
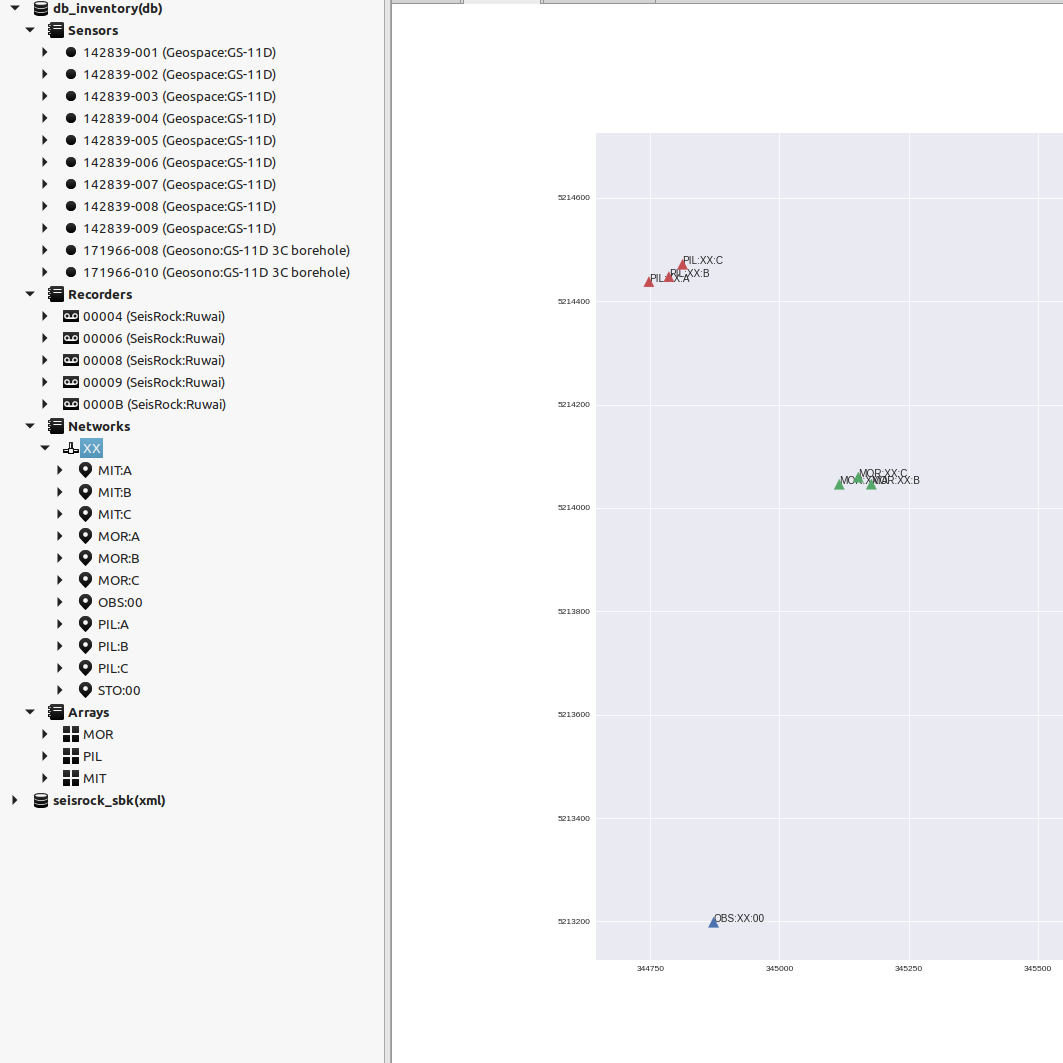
The psysmon geometry is stored in a database. It can be imported from an geometry XML file.
Import data files
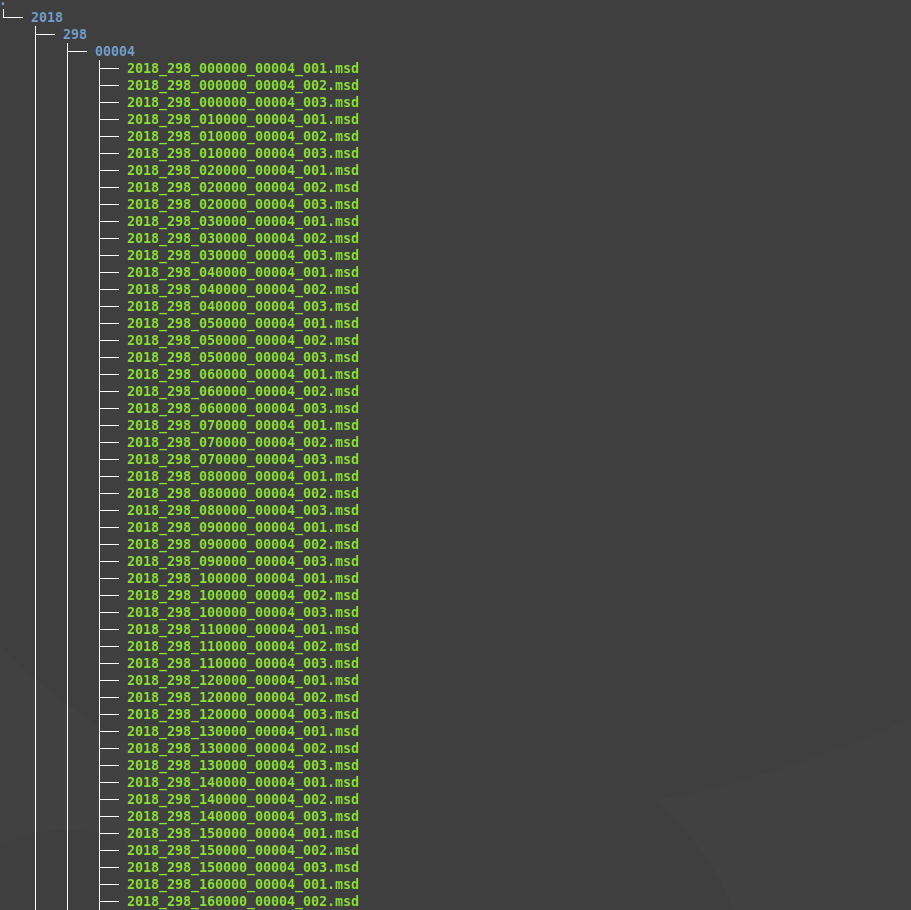
To work with seismic data, the data files have to be imported into the psysmon database first.
Data availability
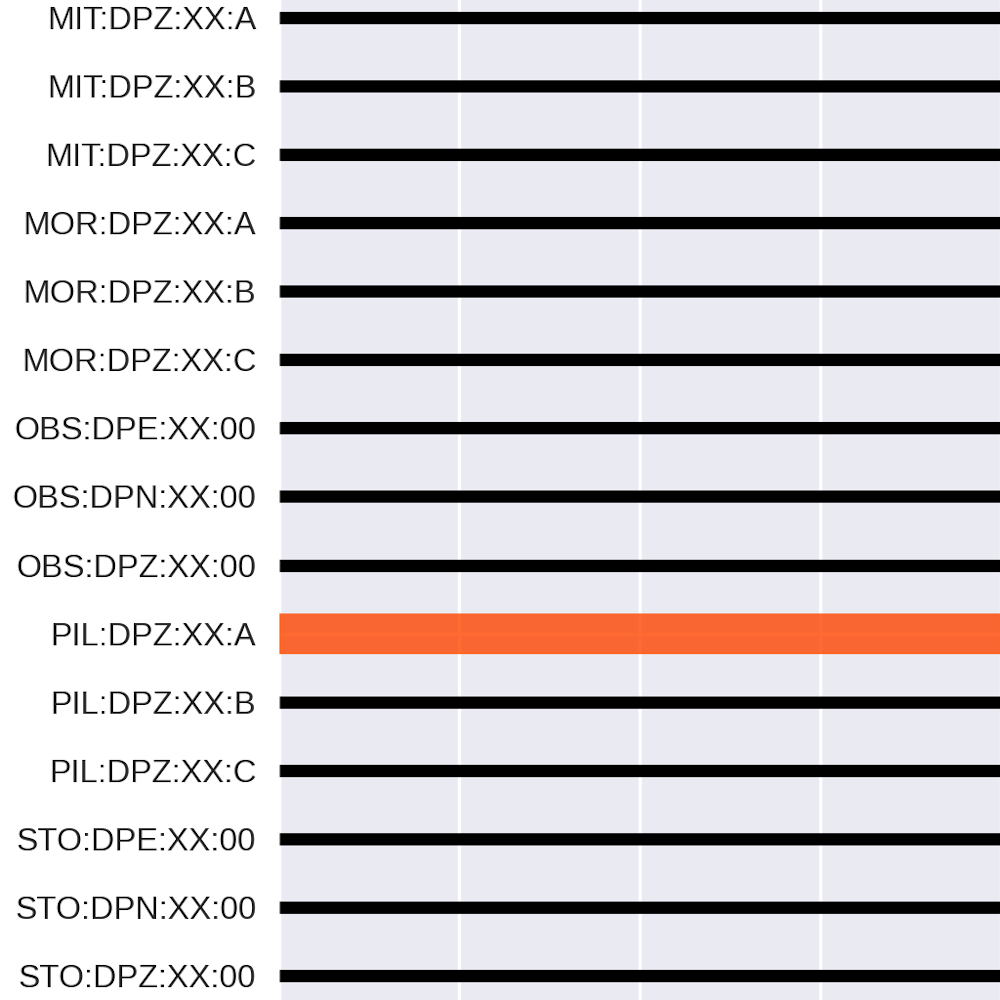
After the data has been imported into the psysmon database, its a good point to get an overview of the imported data. This helps to check if the imported amount of data fits the expected data time range and to detect potentially missing data or possible fundamental problems with e.g. the data format.
Data screening
With psysmon it is easy to interactively screen through a seismic data set to get a first overview of the data quality and the seismic activity.
Power Spectral Density
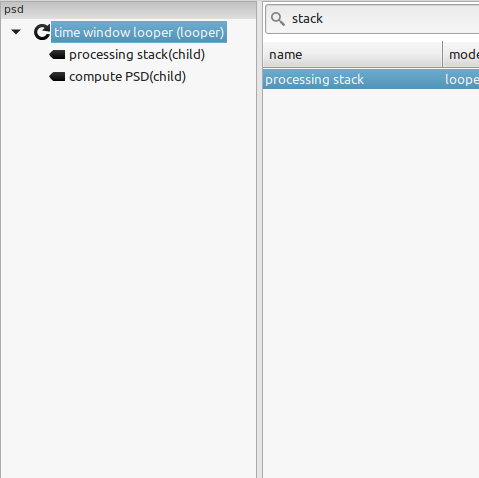
Long term spectrograms are useful to evaluate the data quality and periods of special interest. psysmon provides the tools to compute the power spectral density (PSD) for the complete data set which then can be used to create spectrograms for the desired time spans.
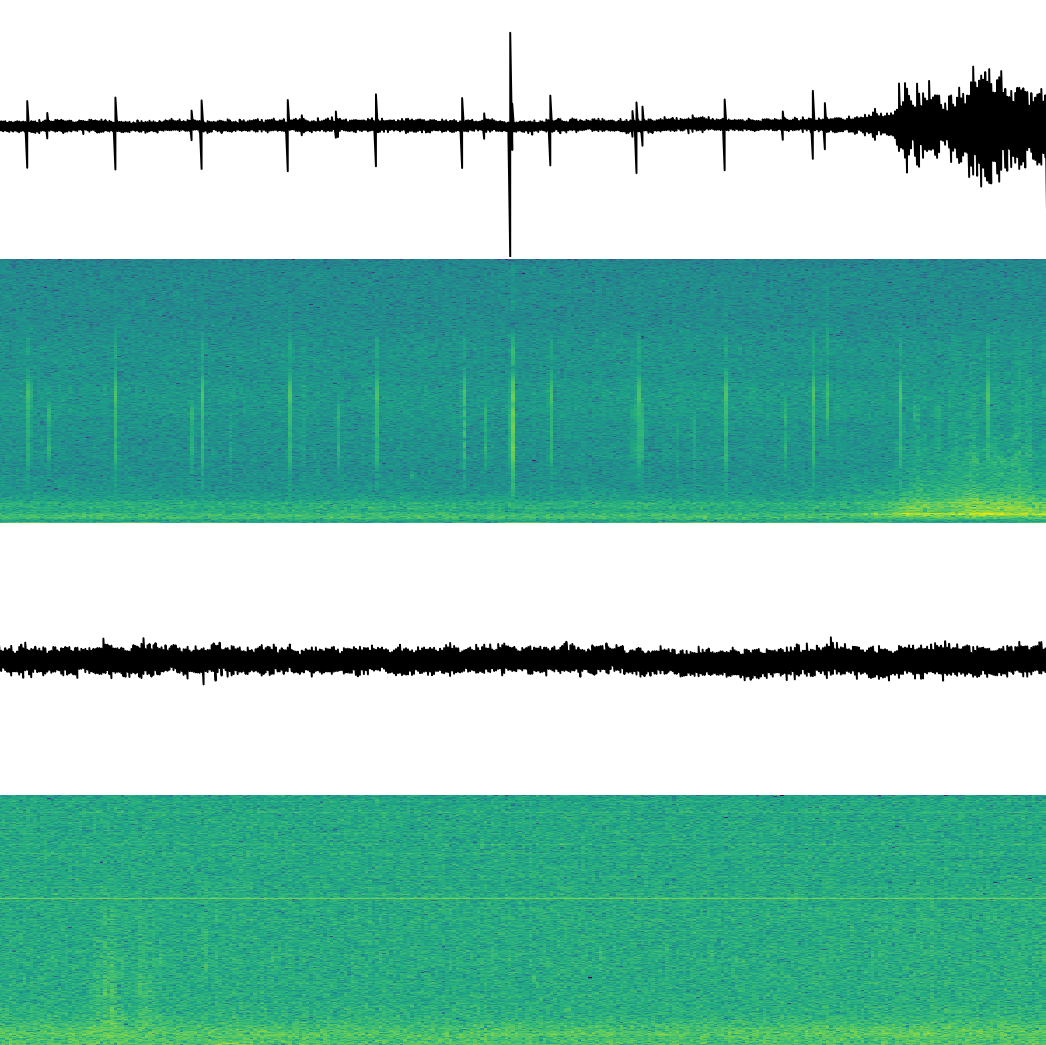
PSD Visualization
The PSD data computed with psysmon can be used to compute spectrograms of various length, from hours, to days or weeks. These plots are useful to assess the data quality and gives an overview of the signals of the data set.
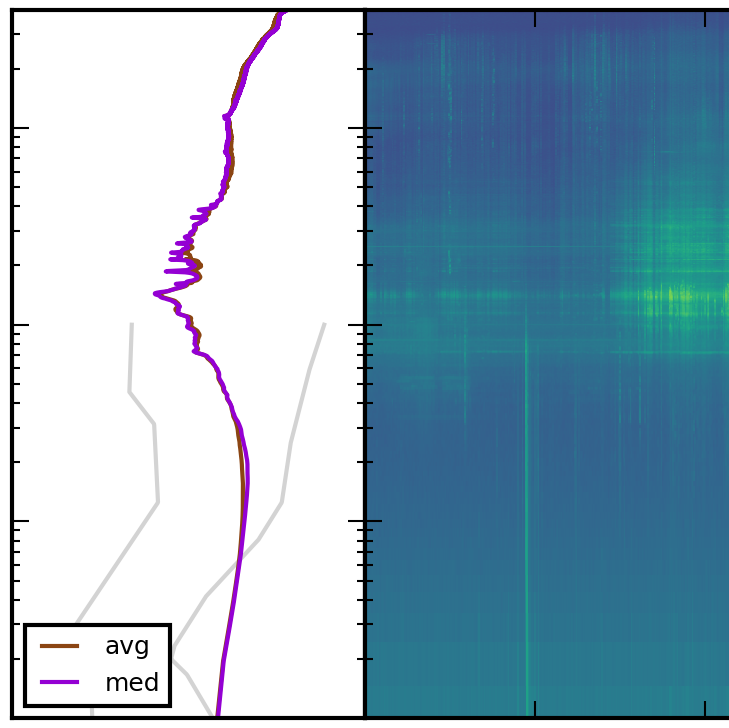
Probability Power Spectral Density
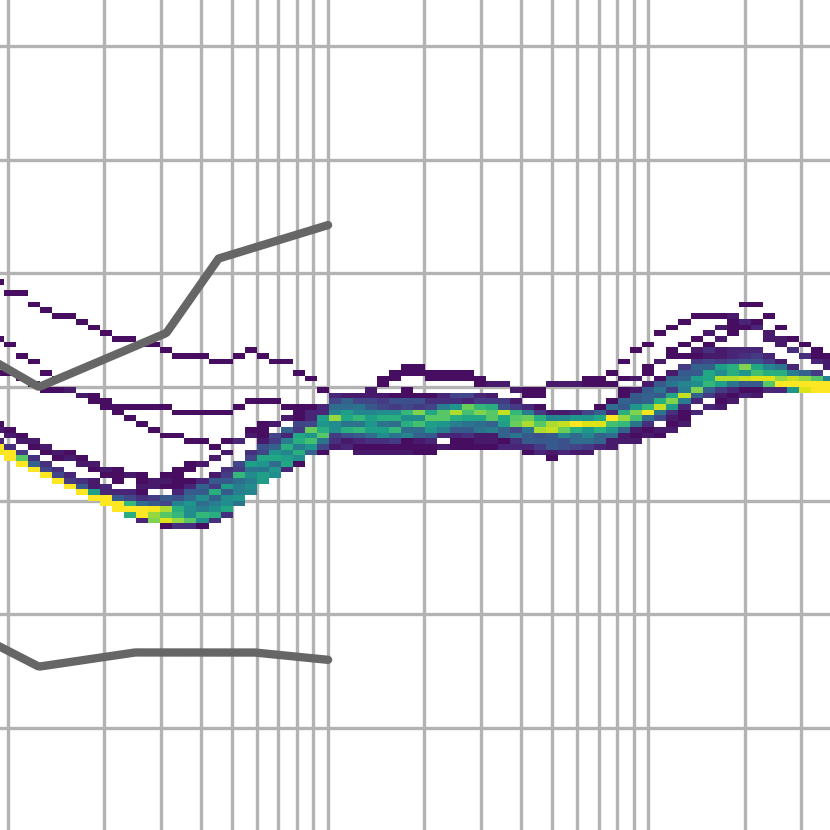
The Probability Power Spectral Density (PPSD) plots are a well known method to assess the data quality of seismic data. The PPSD data computed with psysmon can be used to create PPSD plots for various time spans.
STA/LTA parameters
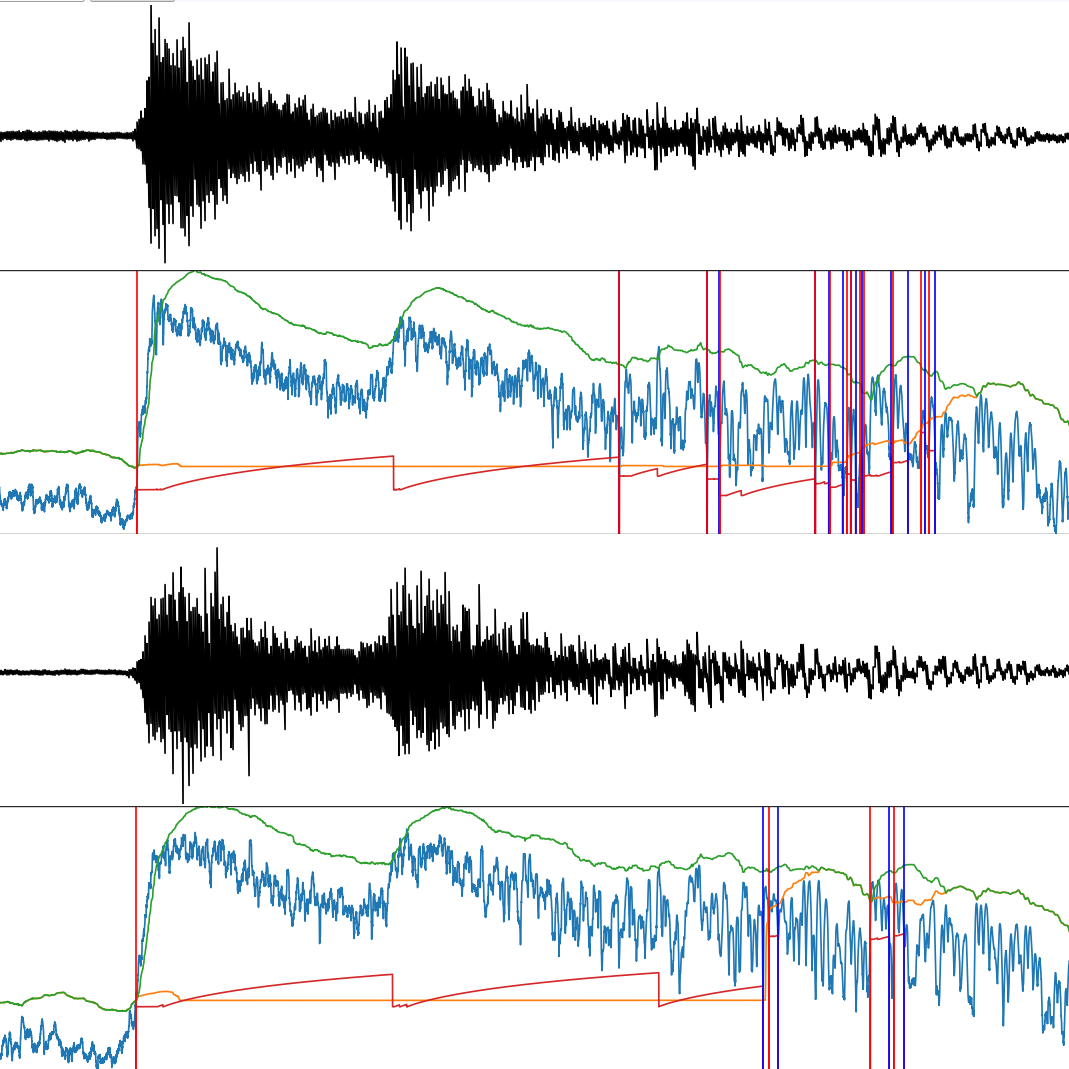
The performance of the STA/LTA detection algorithm heavily depends on the chosen parameters. psysmon provides the possibility to visually check the effects of the parameters on the detection results. This can be done interactively using the original data which is intended to be used for the detection.
STA/LTA detection
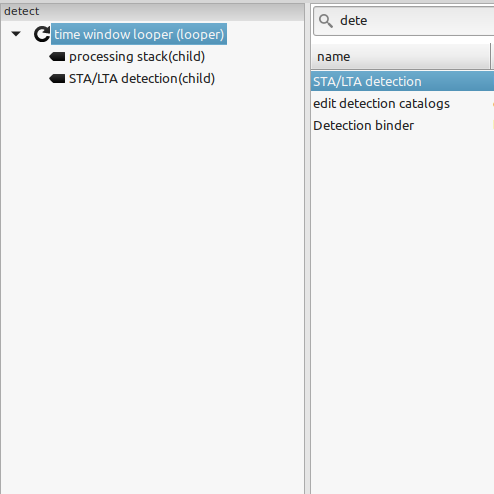
The STA/LTA parameters determined interactively can be used to run the detection on the whole data set. The resulting detections are stored in the database.
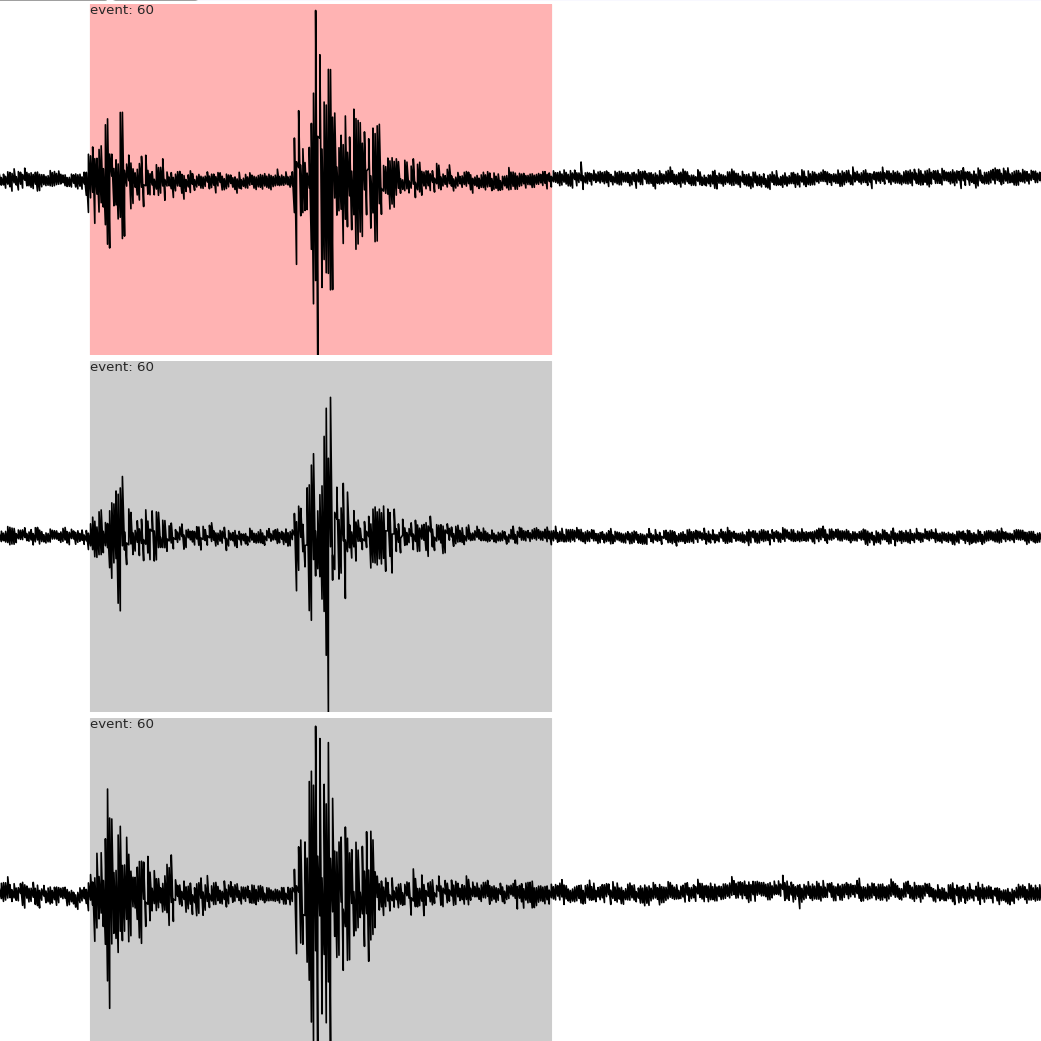
Detection binding
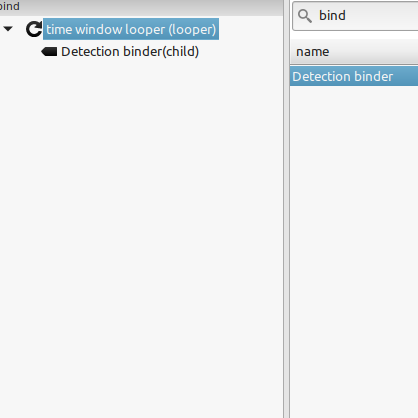
The result of a STA/LTA detection run are signals detected on single traces related to the channel of a seismic station. Detection binding combines these single trace detections to events using temporal and spatial constraints.
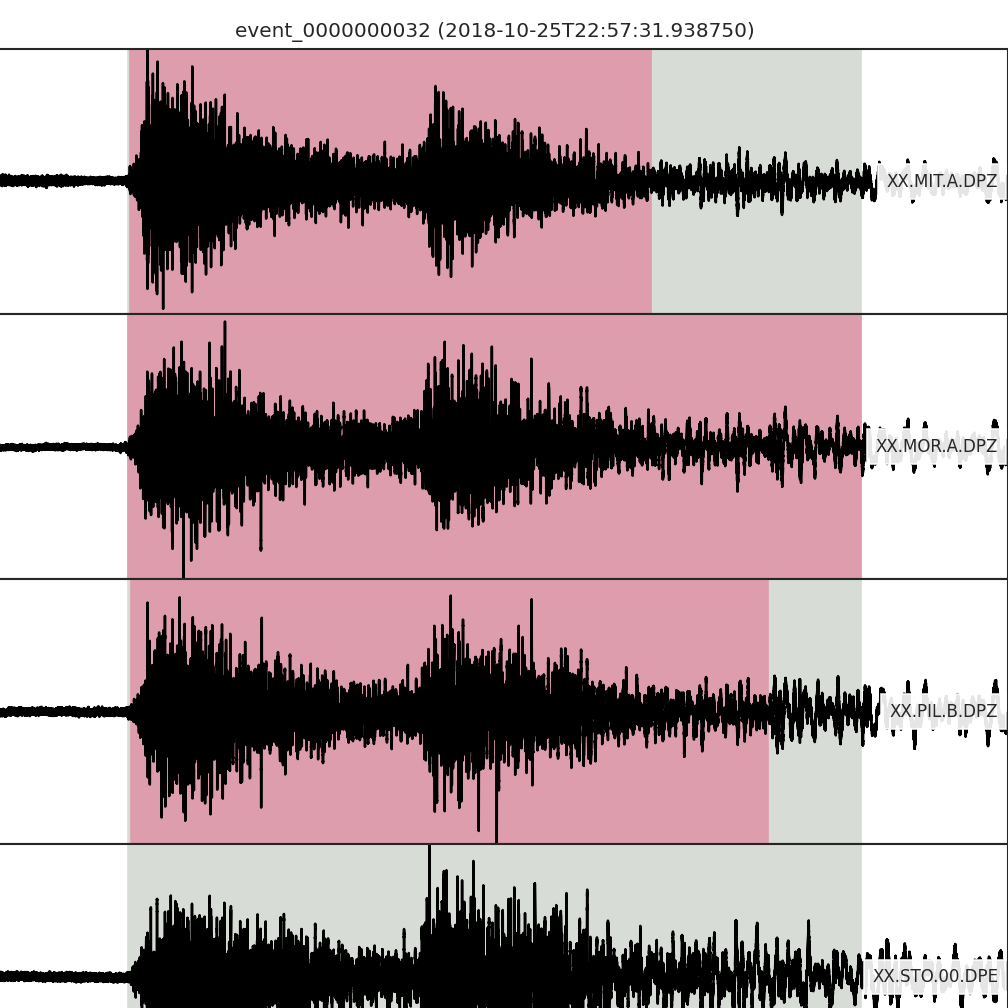
Visual event check
Tracedisplay can be used to access the events in the database and visualize the related data..
Event export
The detected events and the associated waveform data can be exported to machine readable data files for further analyses.
Event picking
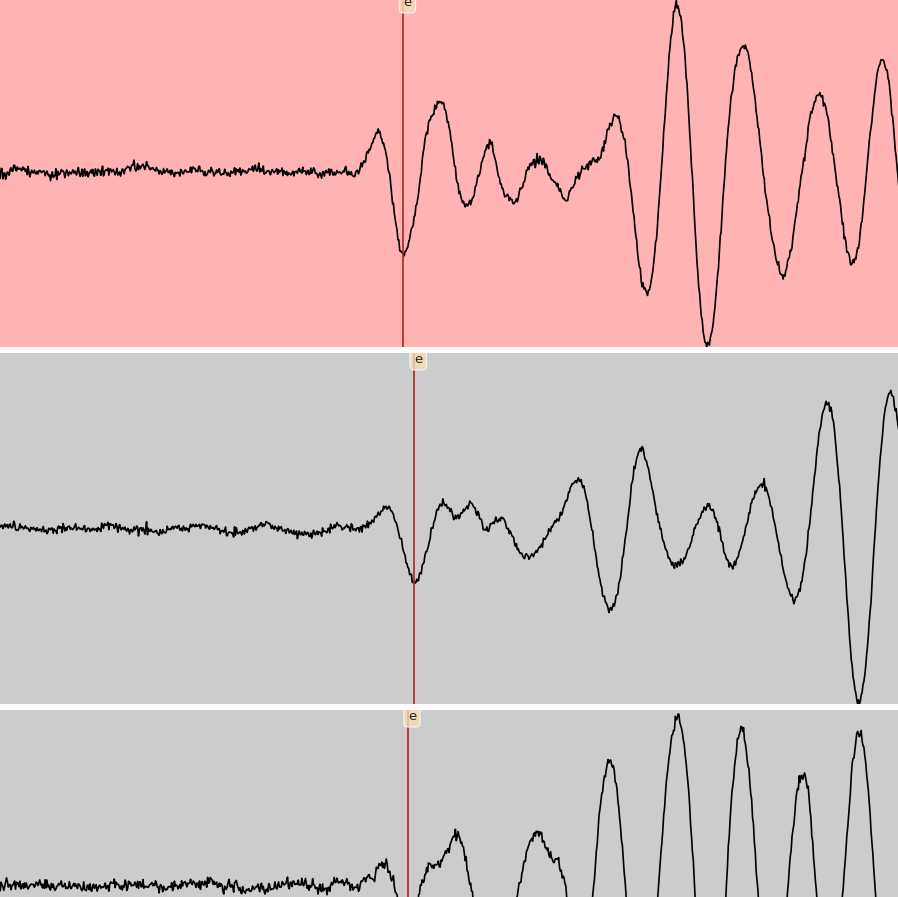
The times of onsets and seismic phases or other highlights in the seismograms can be picked in the tracedisplay window and exported for later use.
Characteristic parameters
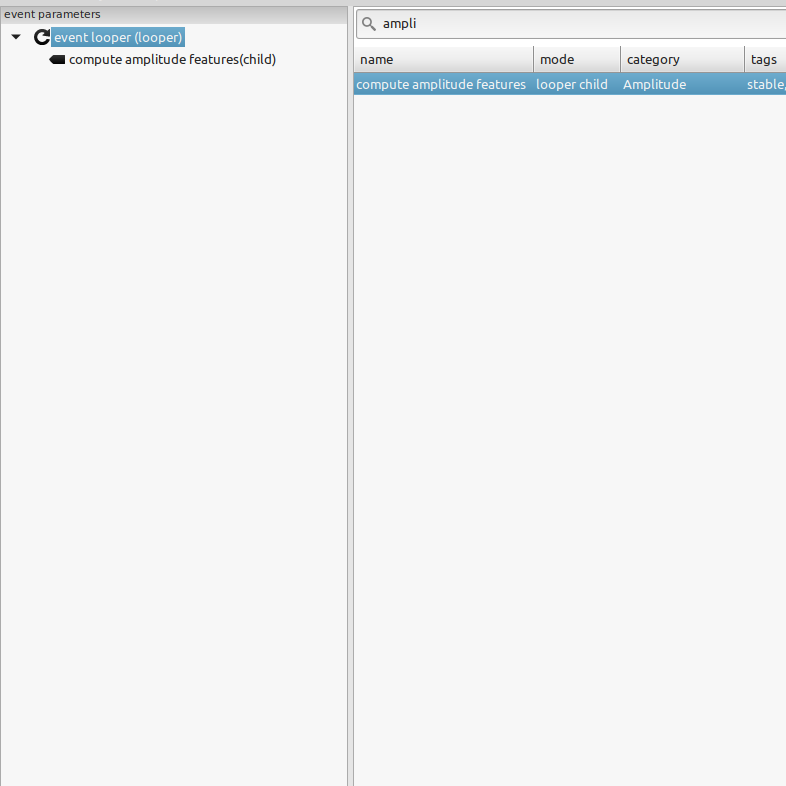
For each detected event, characteristic amplitude parameters are computed which can be used to search for similarities among the individual events.