Interactive screening of the imported data.
Data screening
On this page
The interactive screening of a dataset is a main application of psysmon. The dataset can be examined using various visualization techniques (e.g. seismogram, spectrogram) and custom visualization plugins can be added easily. This enables testing new algorithms or processing methods on a complete real-world data set.
Create the display collection
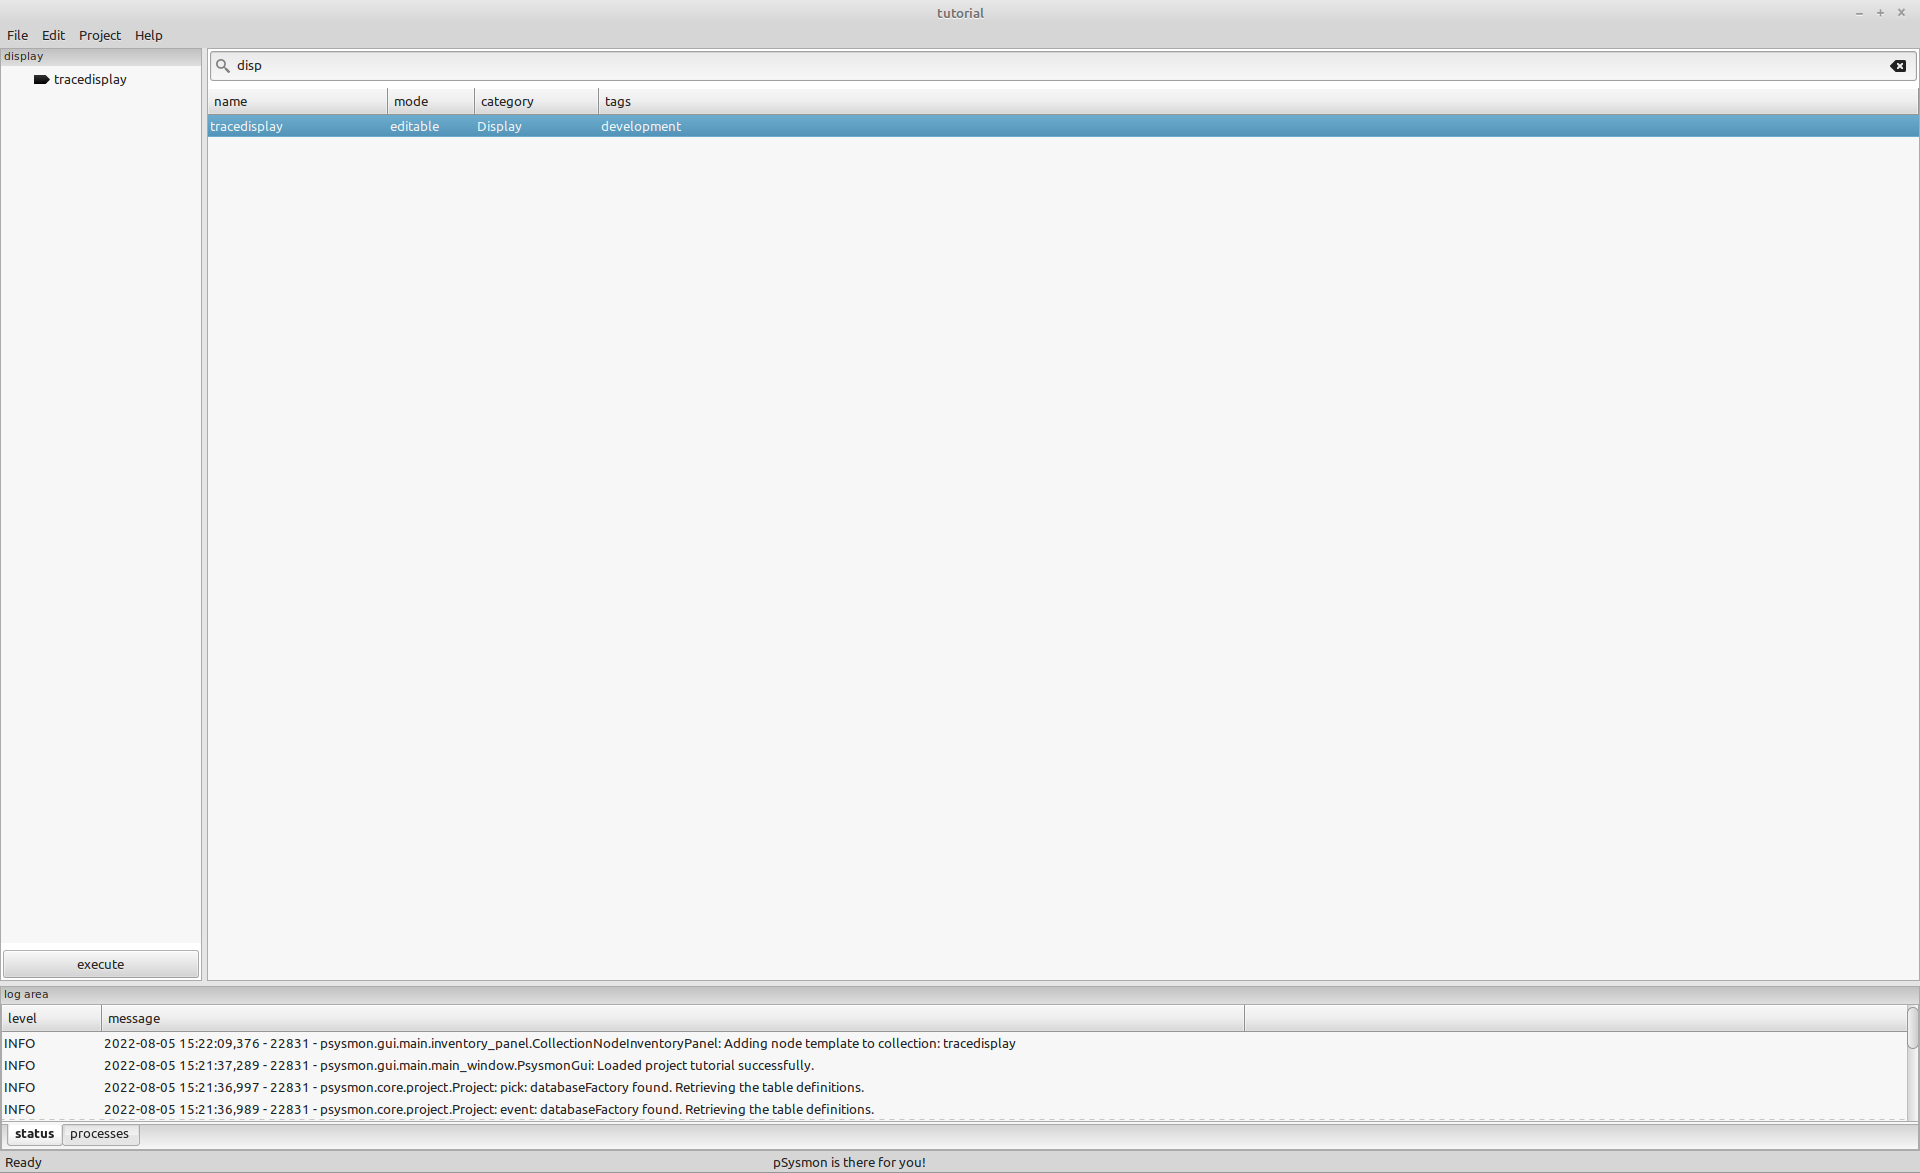
Create a collection named display and add the collection node tracedisplay to the collection.
Edit the tracedisplay preferences
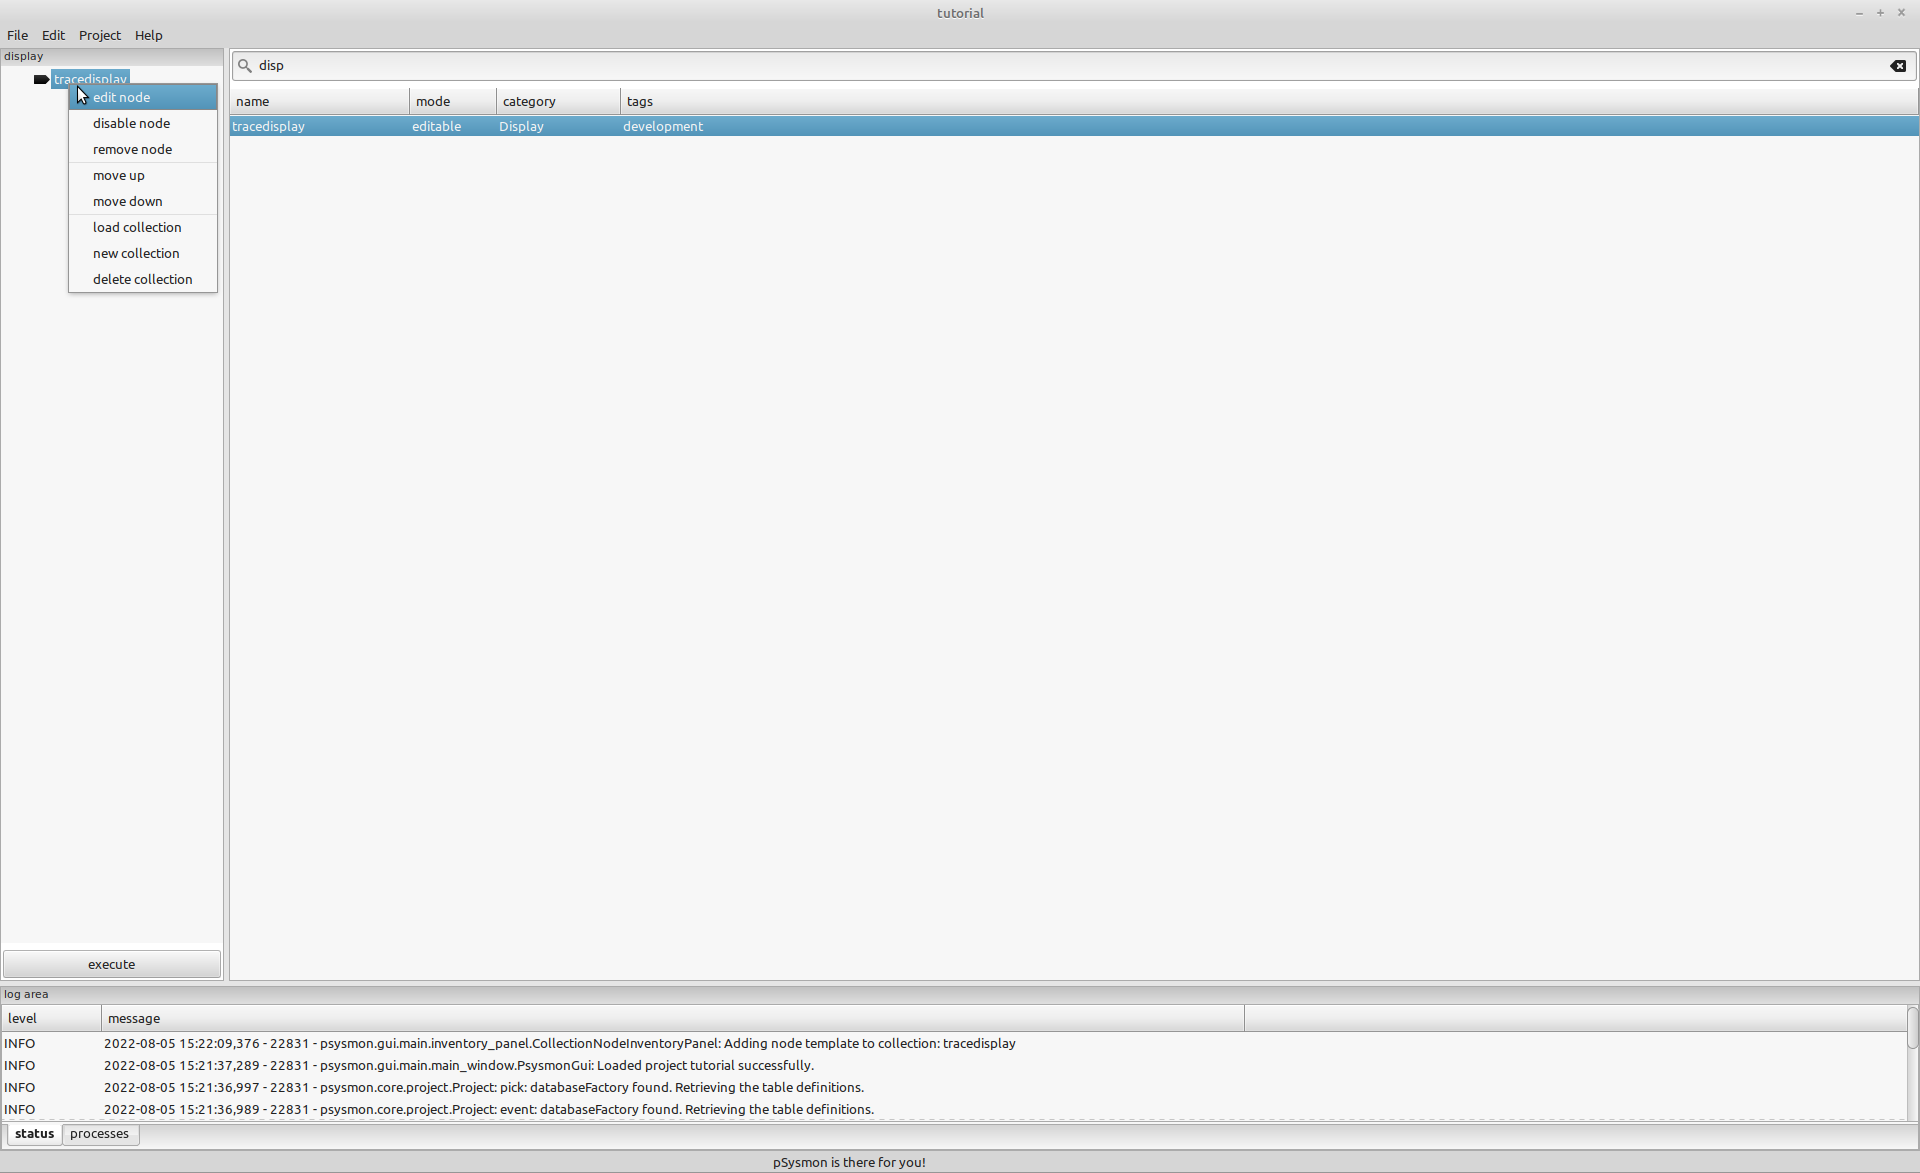
Open the tracedisplay preferences dialog using the context menu in the collection listbox.
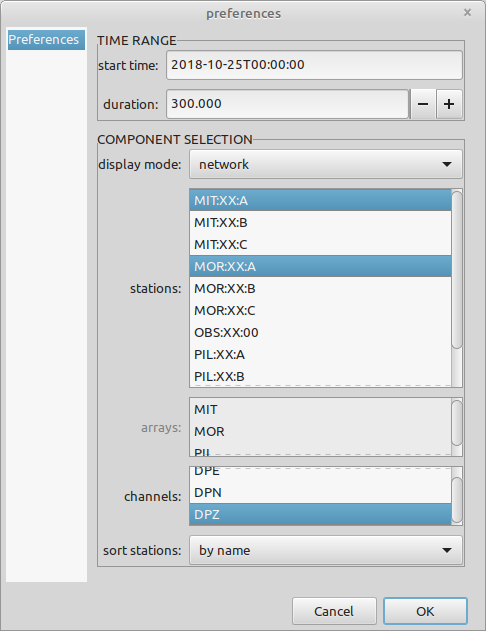
The preferences dialog will appear. Select the following preferences:
- start time
- 2018-10-25T00:00:00
- duration
- 300
- display mode
- network
- stations
- MIT:XX:A, MOR:XX:A
(hold the
CTRLkey to select multiple single stations,SHIFTfor a range) - array
- This field is disabled
- channels
- DPZ
- sort station
- by name
Execute the collection
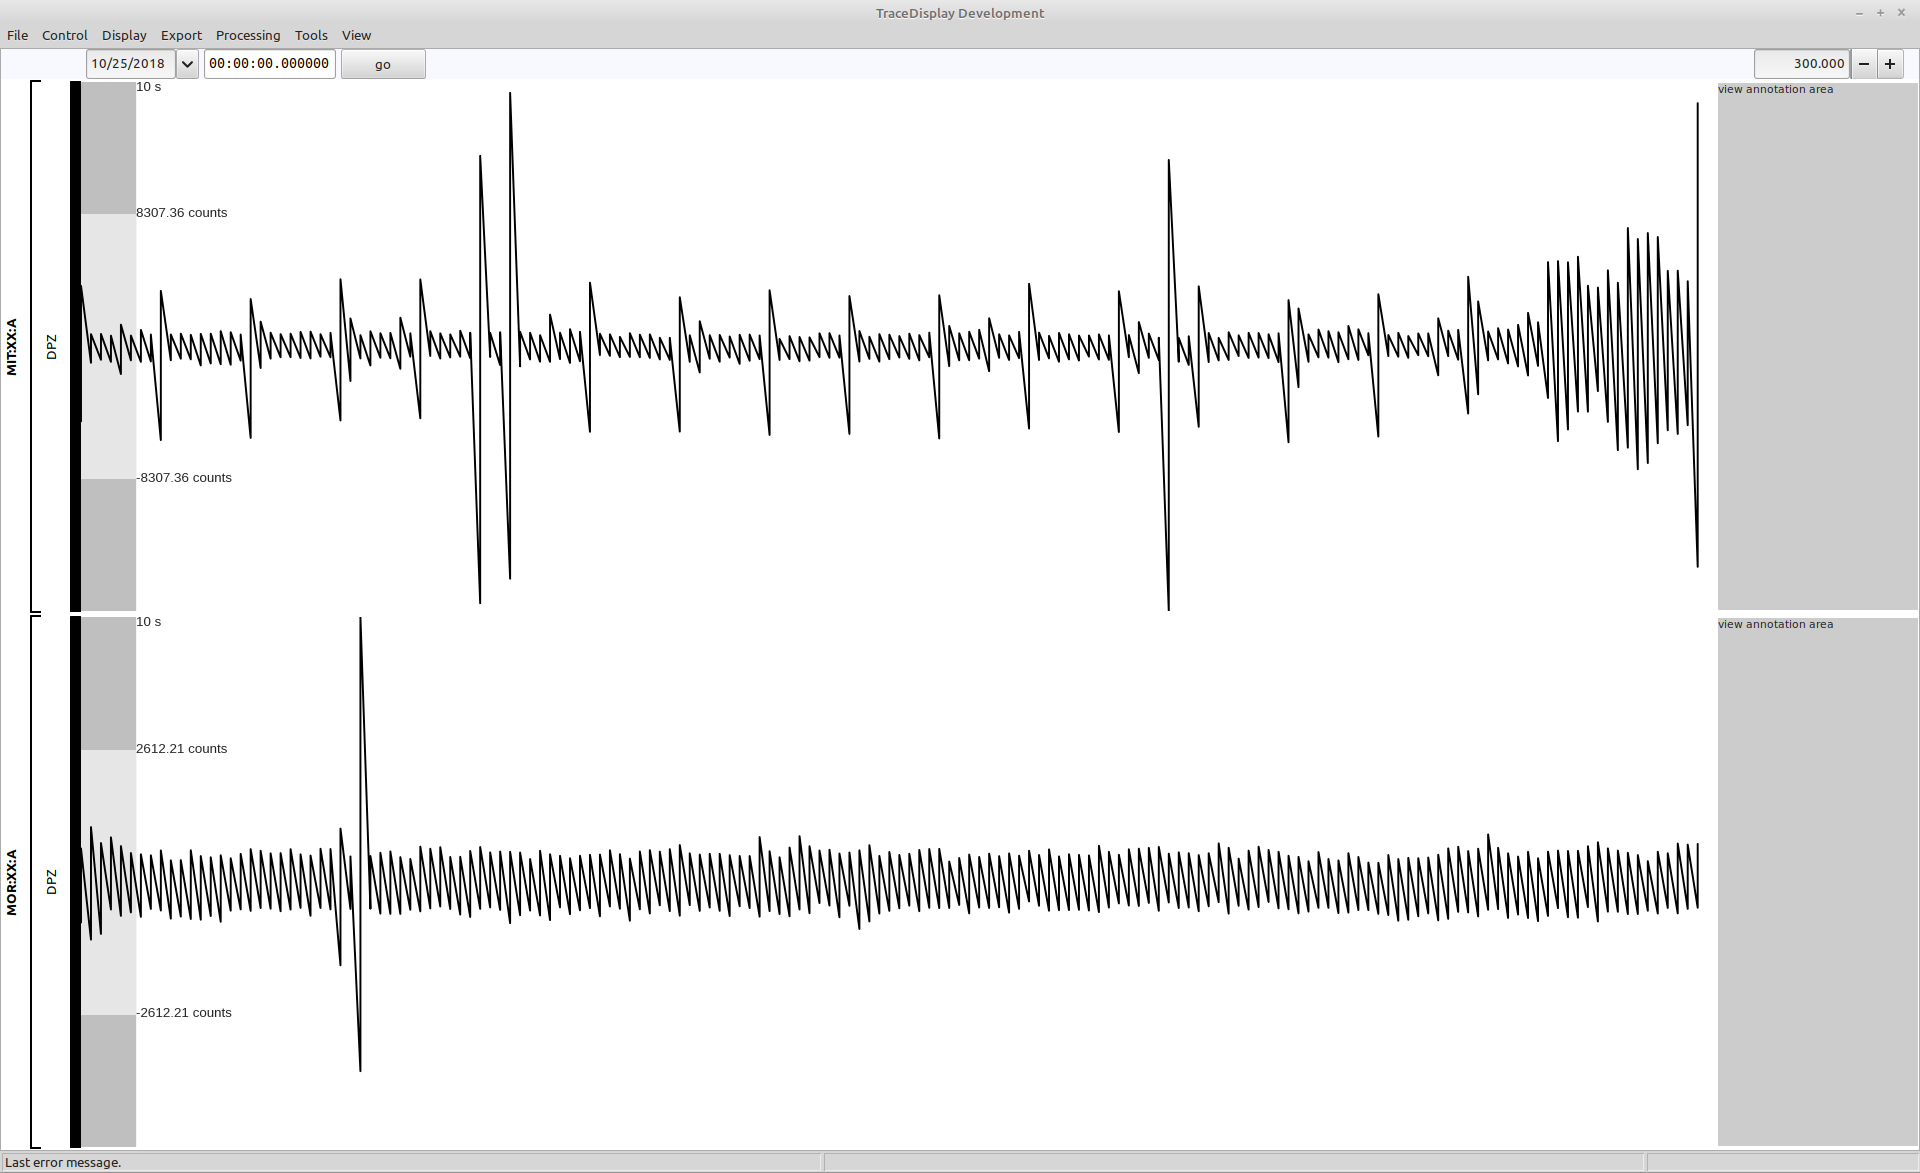
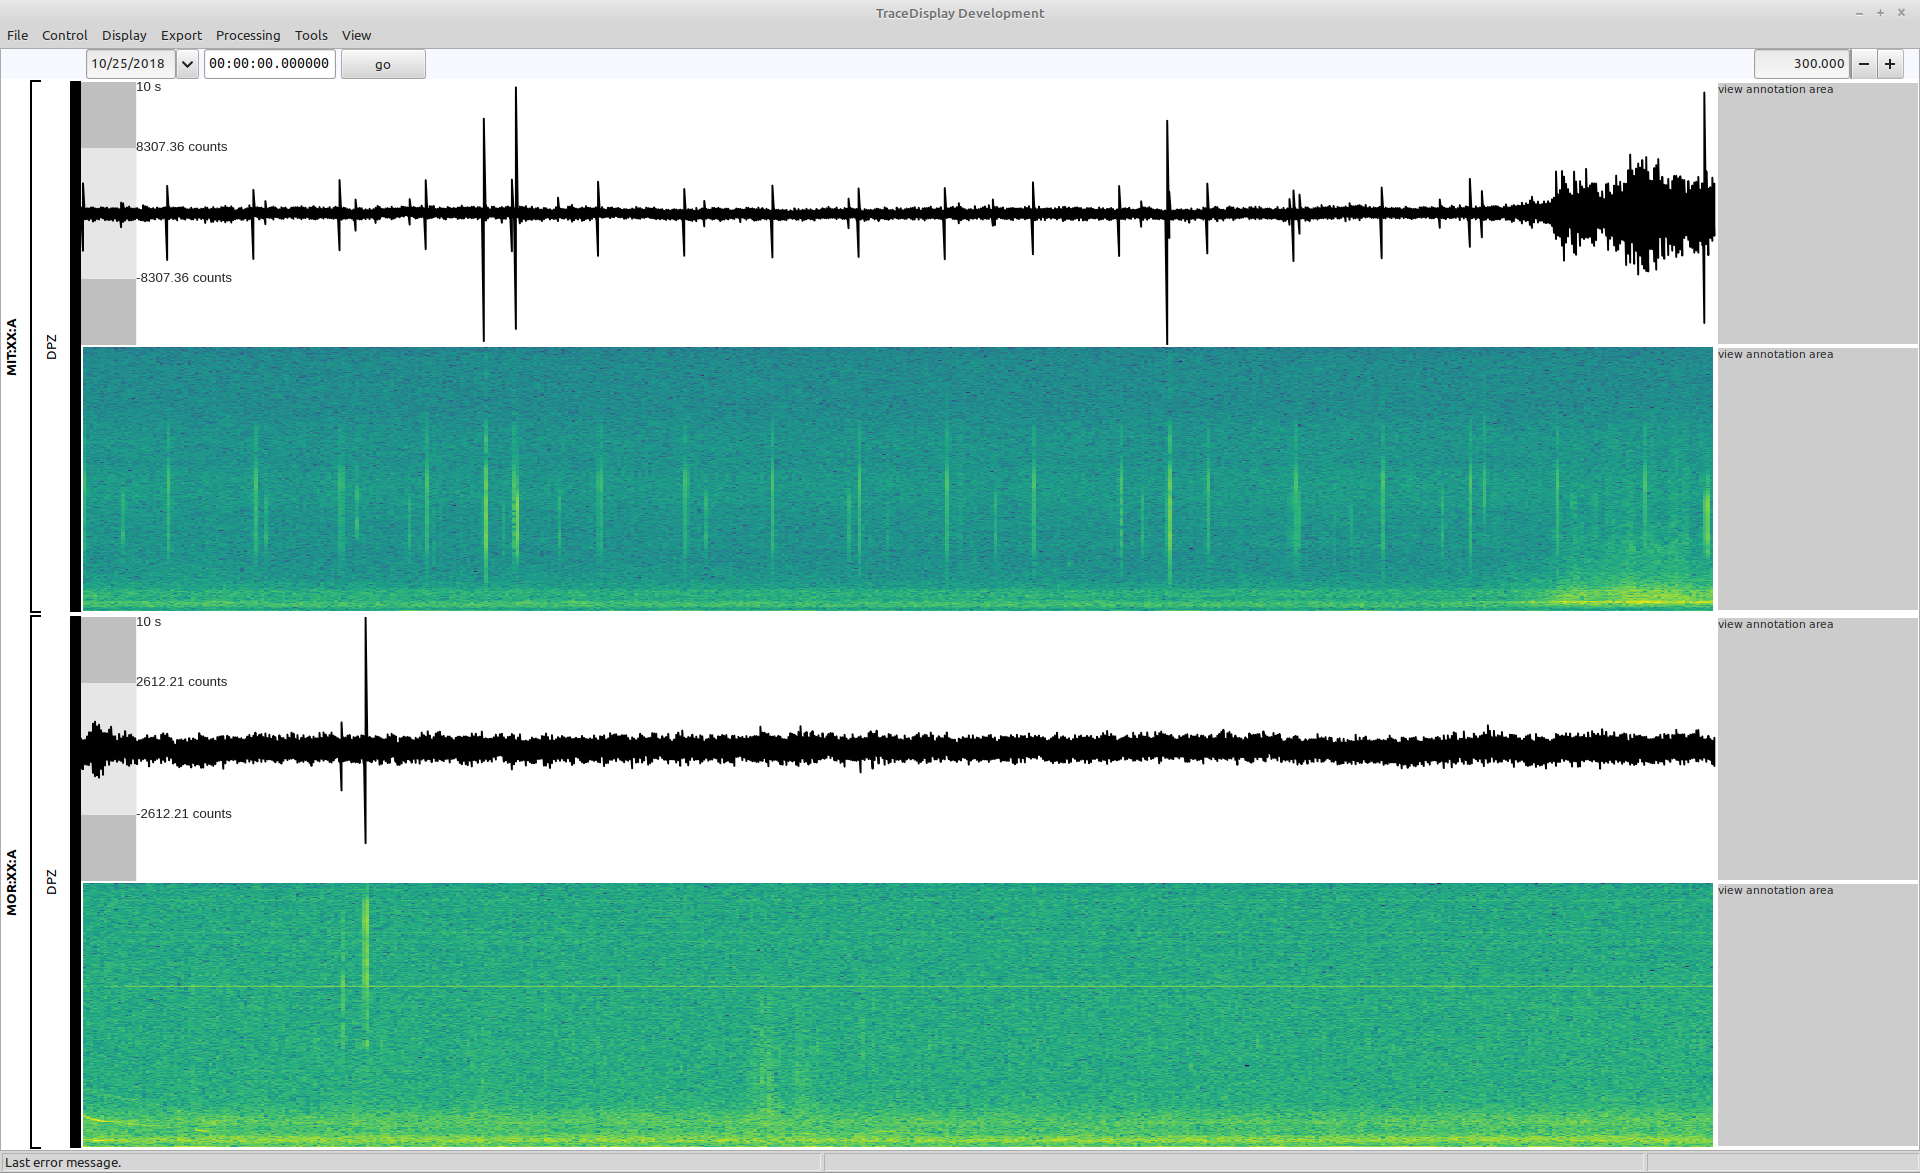
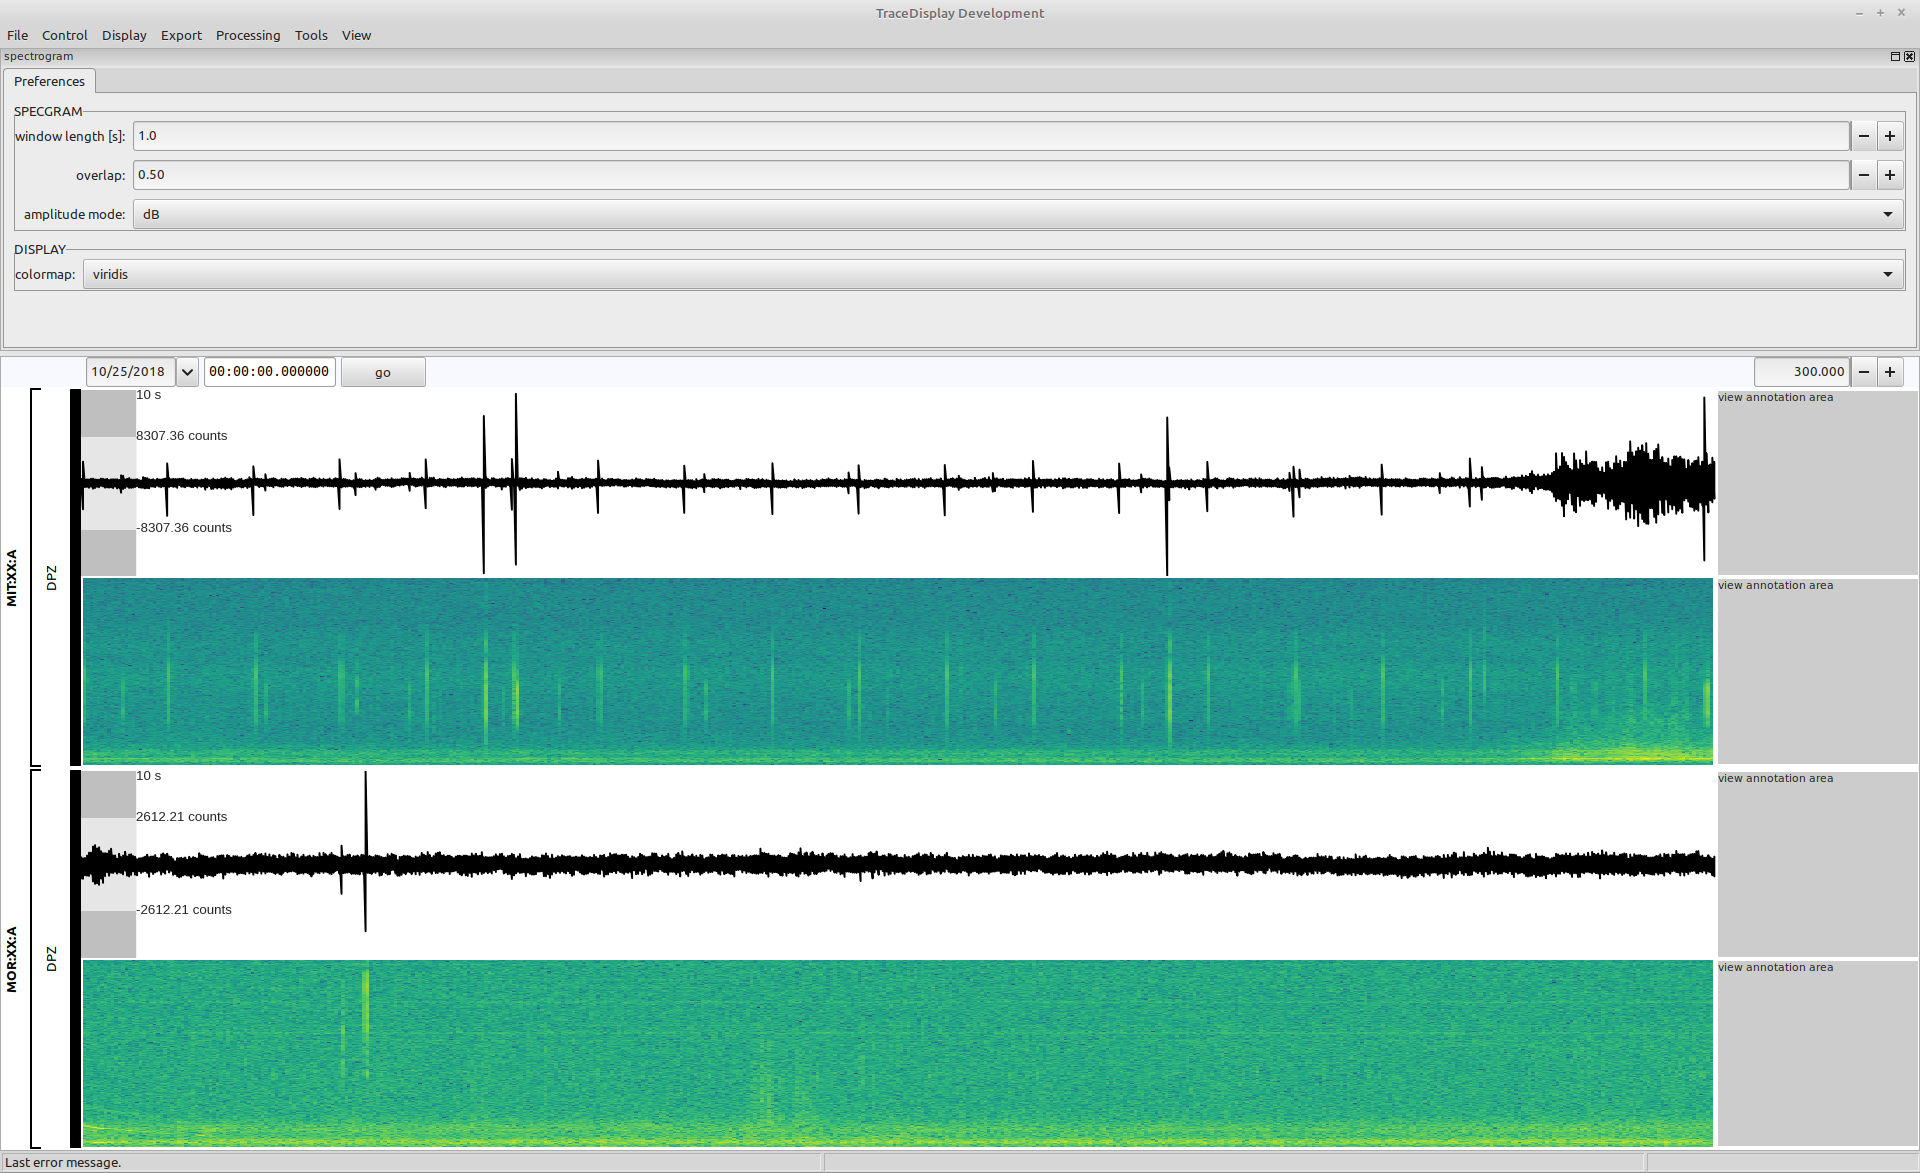
Execute the display collection by clicking the execute button and the tracedisplay dialog will appear. The initial view shows the seismograms of the selected channels. It might happen, that the first view shows a strange zig-zag pattern. This is because of an issue with the initial resizing of the dialog window. You can fix this problem by refreshing the display using the menu Control->refresh views or by using the shortcut key R.

Add the spectrogram view
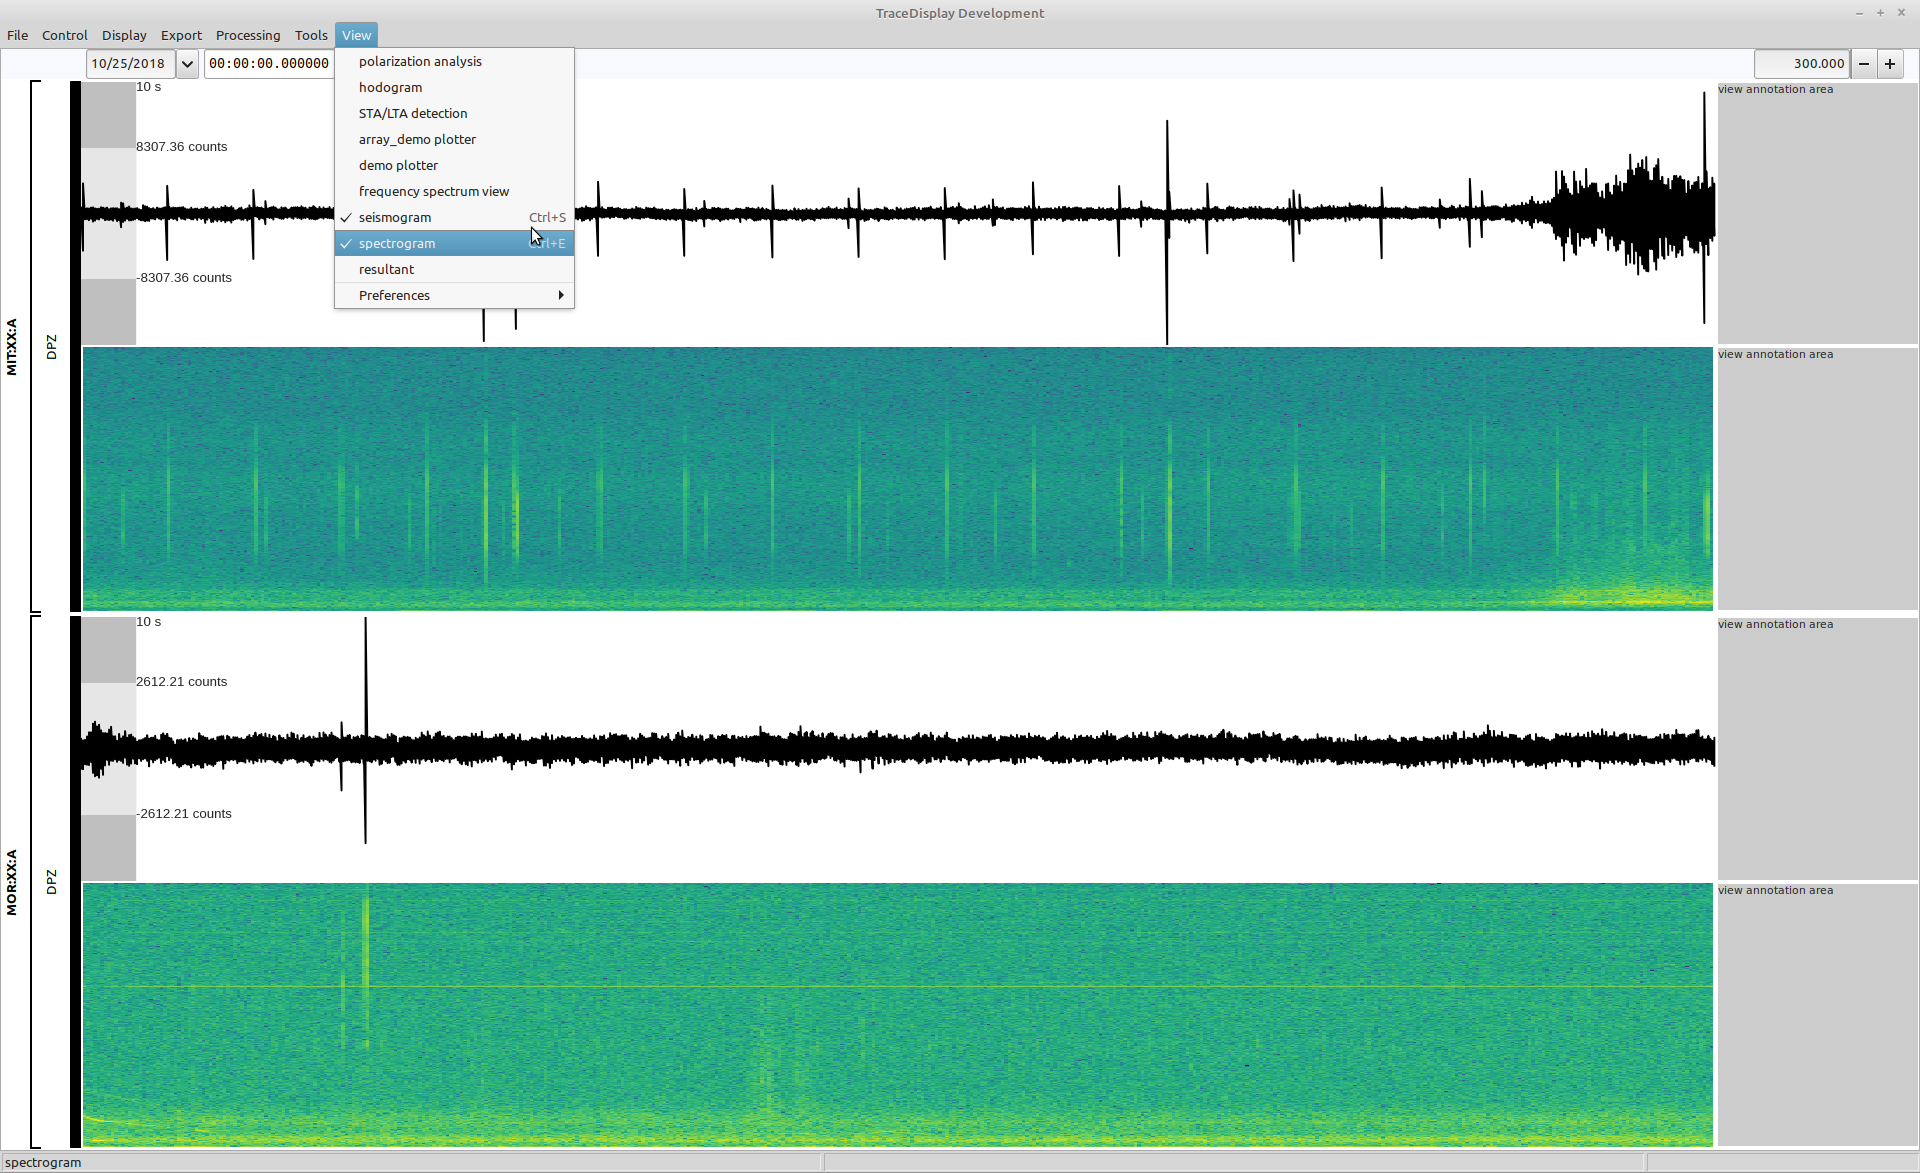
For each channel you can add different views. The seismogram view is the default view. Add the spectrogram view of the data using the menu View->spectrogram or by pressing the shortcut key CTRL+E.
Navigate through the data
You can shift the displayed data in time by using the left and right arrow keys. Using the accelerators SHIFT, CTRL or ALT while pressing one of the arrow keys decreases the shifted time step.
You can use the + and - keys to zoom in or out of the data. Again using the accelerator keys SHIFT, CTRL or ALT while pressing one of the zoom keys decreases the zoom step.
You can use the datetime and duration edit fields on top of the tracedisplay window (just below the menu bar) to select a time range to display.
Using shortcuts
The tracedisplay dialog provides shortcuts for frequently used commands and options. The shortcuts are listed besides the menu entries in the submenus of the menu bar. For example, use CTRL+E to toggle the spectrogram view.
Plugin preferences
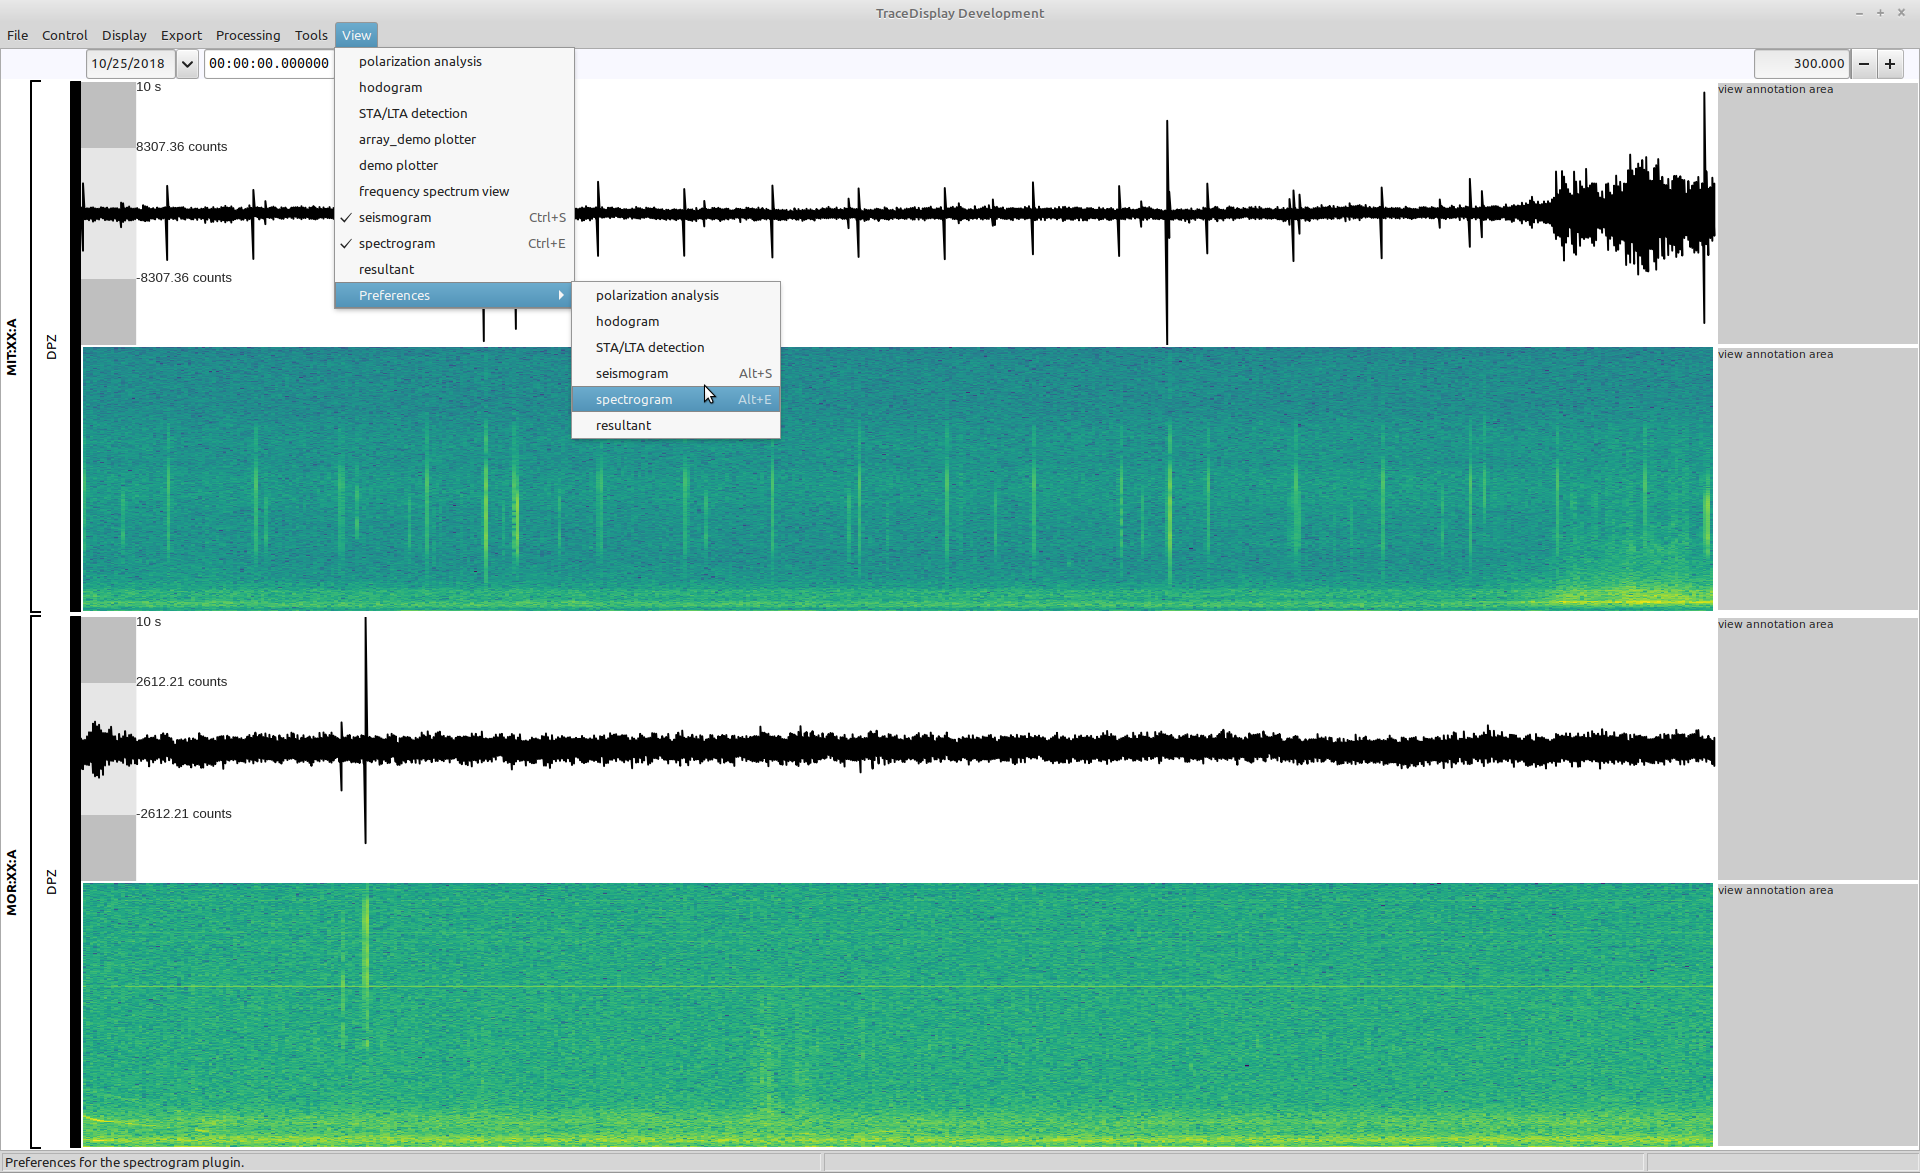
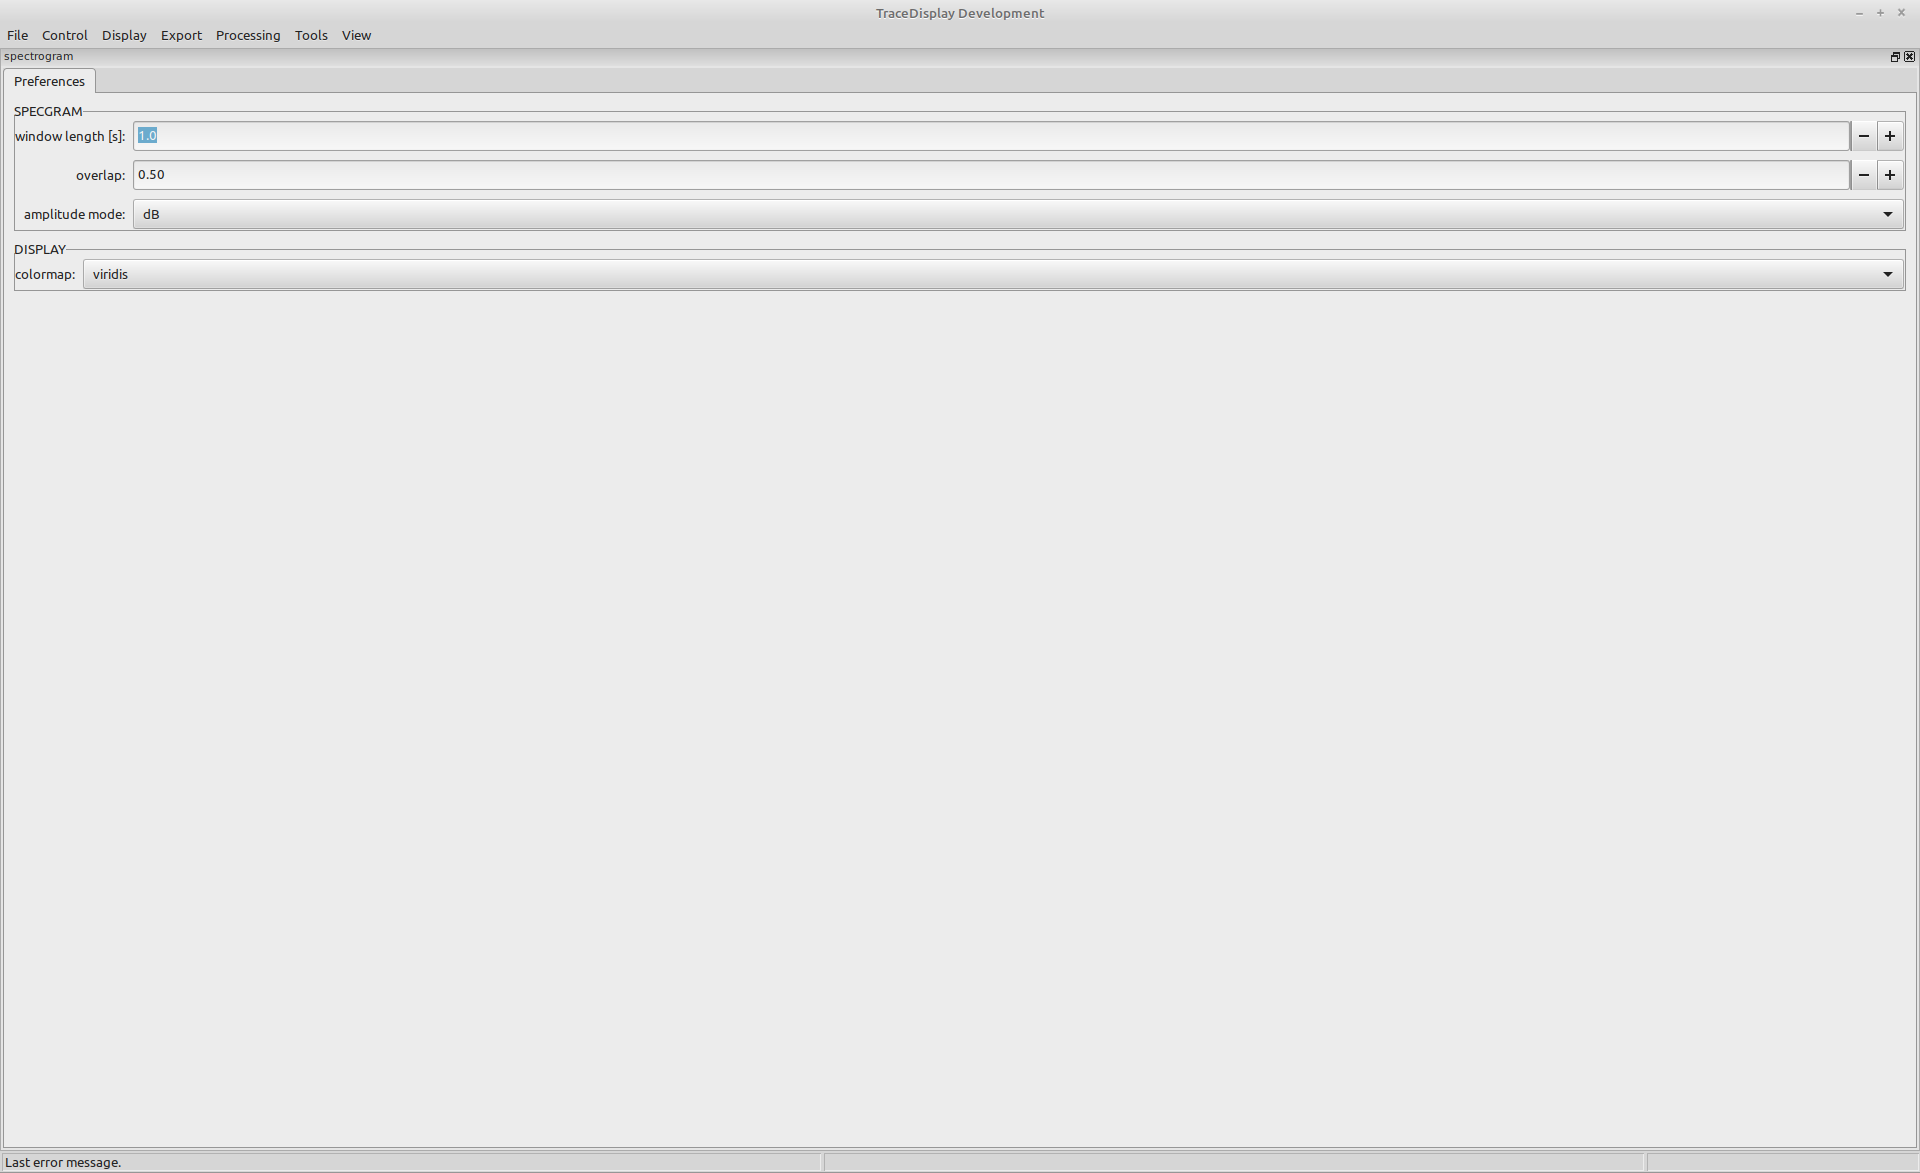
The views, tools and commands available via the tracedisplay menu bar are created by plugins. Each plugin has the option to provide preferences which can be accessed using the Preferences submenu in the tracedisplay menu bar. For example, to open the preferences of the spectrogram view, select the menu View->Preferences->Spectrogram (or use the shortcut ALT-E).
The preferences of the spectrogram view will open as a docking frame on the right side of the tracedisplay window.
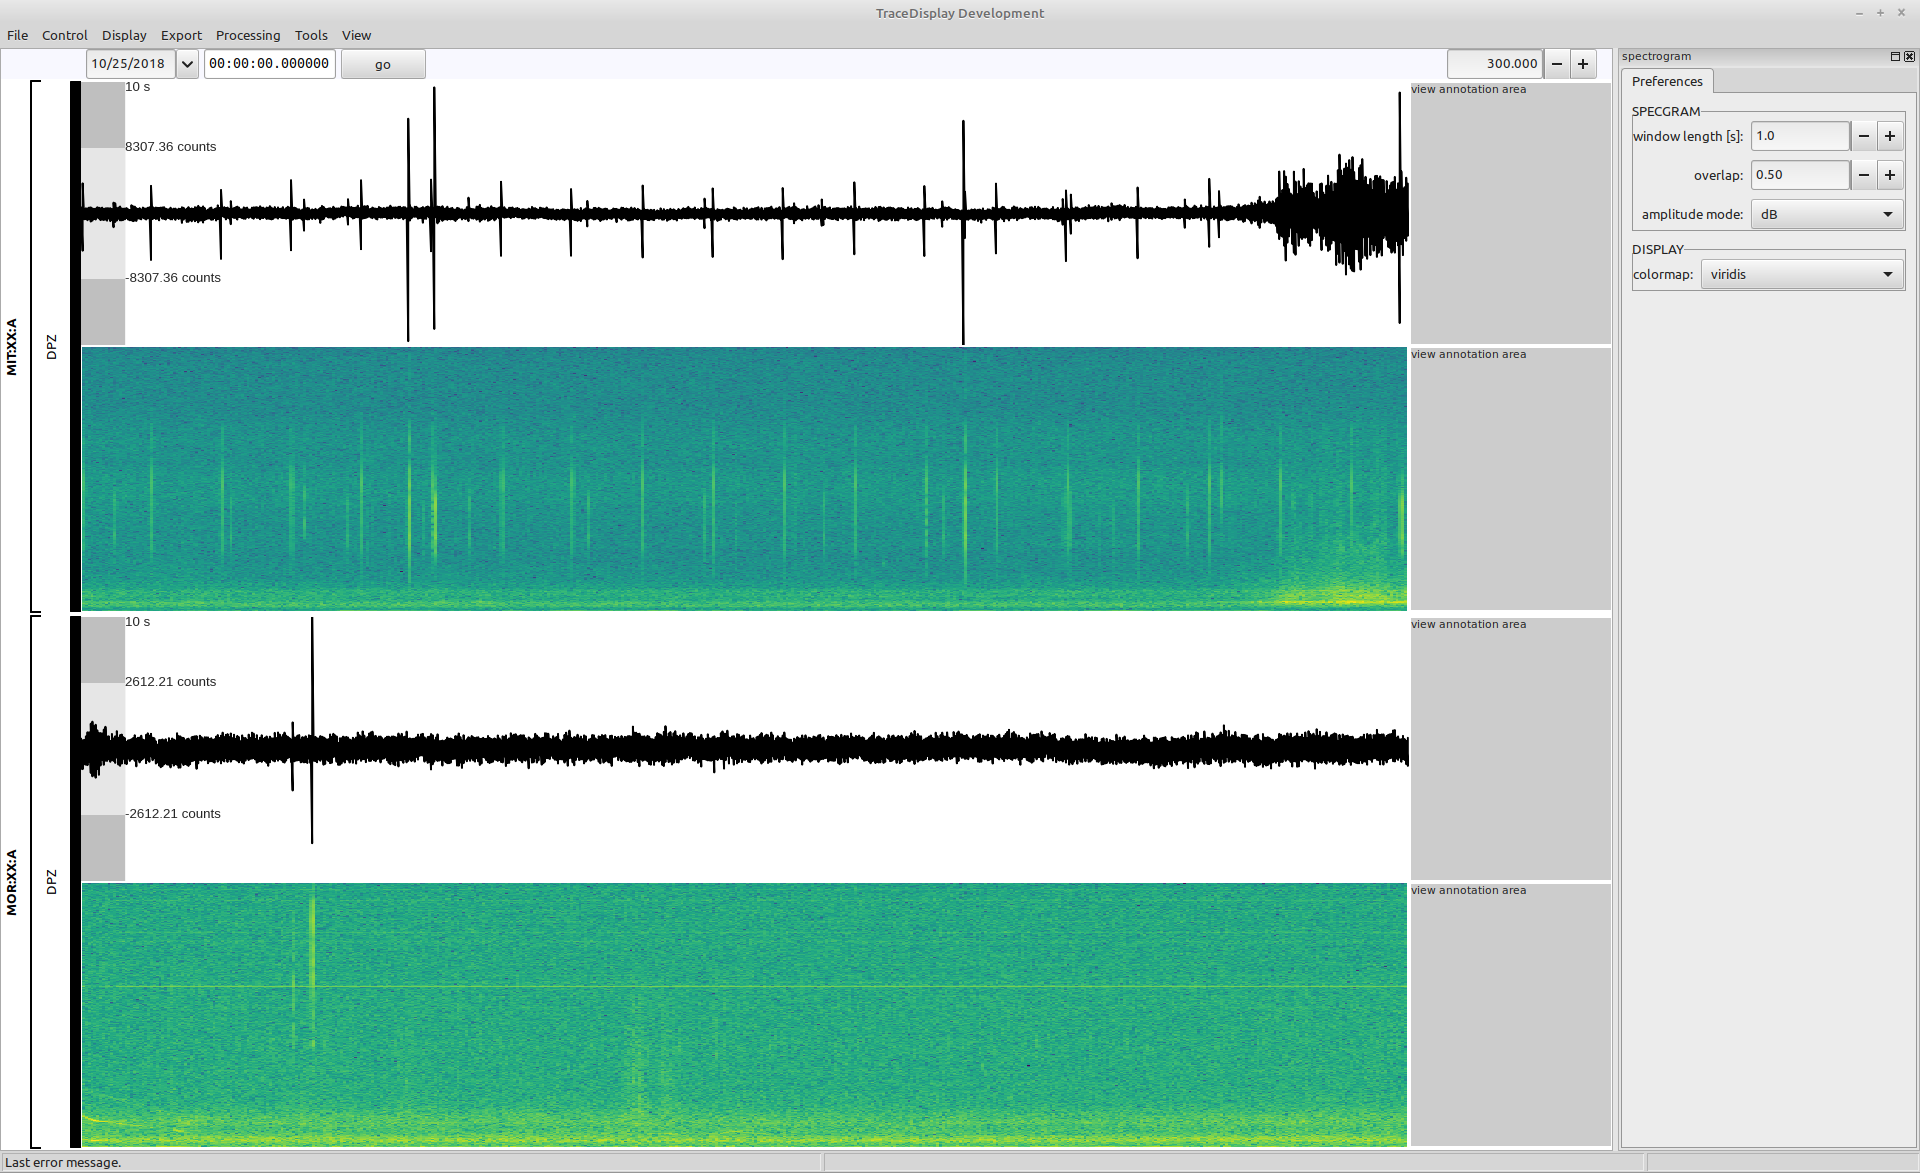
You can toggle the display of the preferences docking frame using the preferences menu entry (e.g. View->Preferences->Spectrogram) or the related shortcut (e.g. ALT-E). You can also close it using the close button on the top right of the preferences docking frame. There you also have a maximize button which you can use to maximize the docking frame for a better accessibility of the preference items.
You can resize the docking frame by click-and-drag of the border between the preferences docking frame and the tracedisplay view frame. The tracedisplay view frame is the part of the tracedisplay window showing the seismograms and spectrograms.
You also have the option to click and drag the preferences docking frame using its title bar. This will undock the preferences frame from the tracedisplay window. You can use it as a separate window on your display or dock it at another position to the tracedisplay window.
Applying plugin preference changes
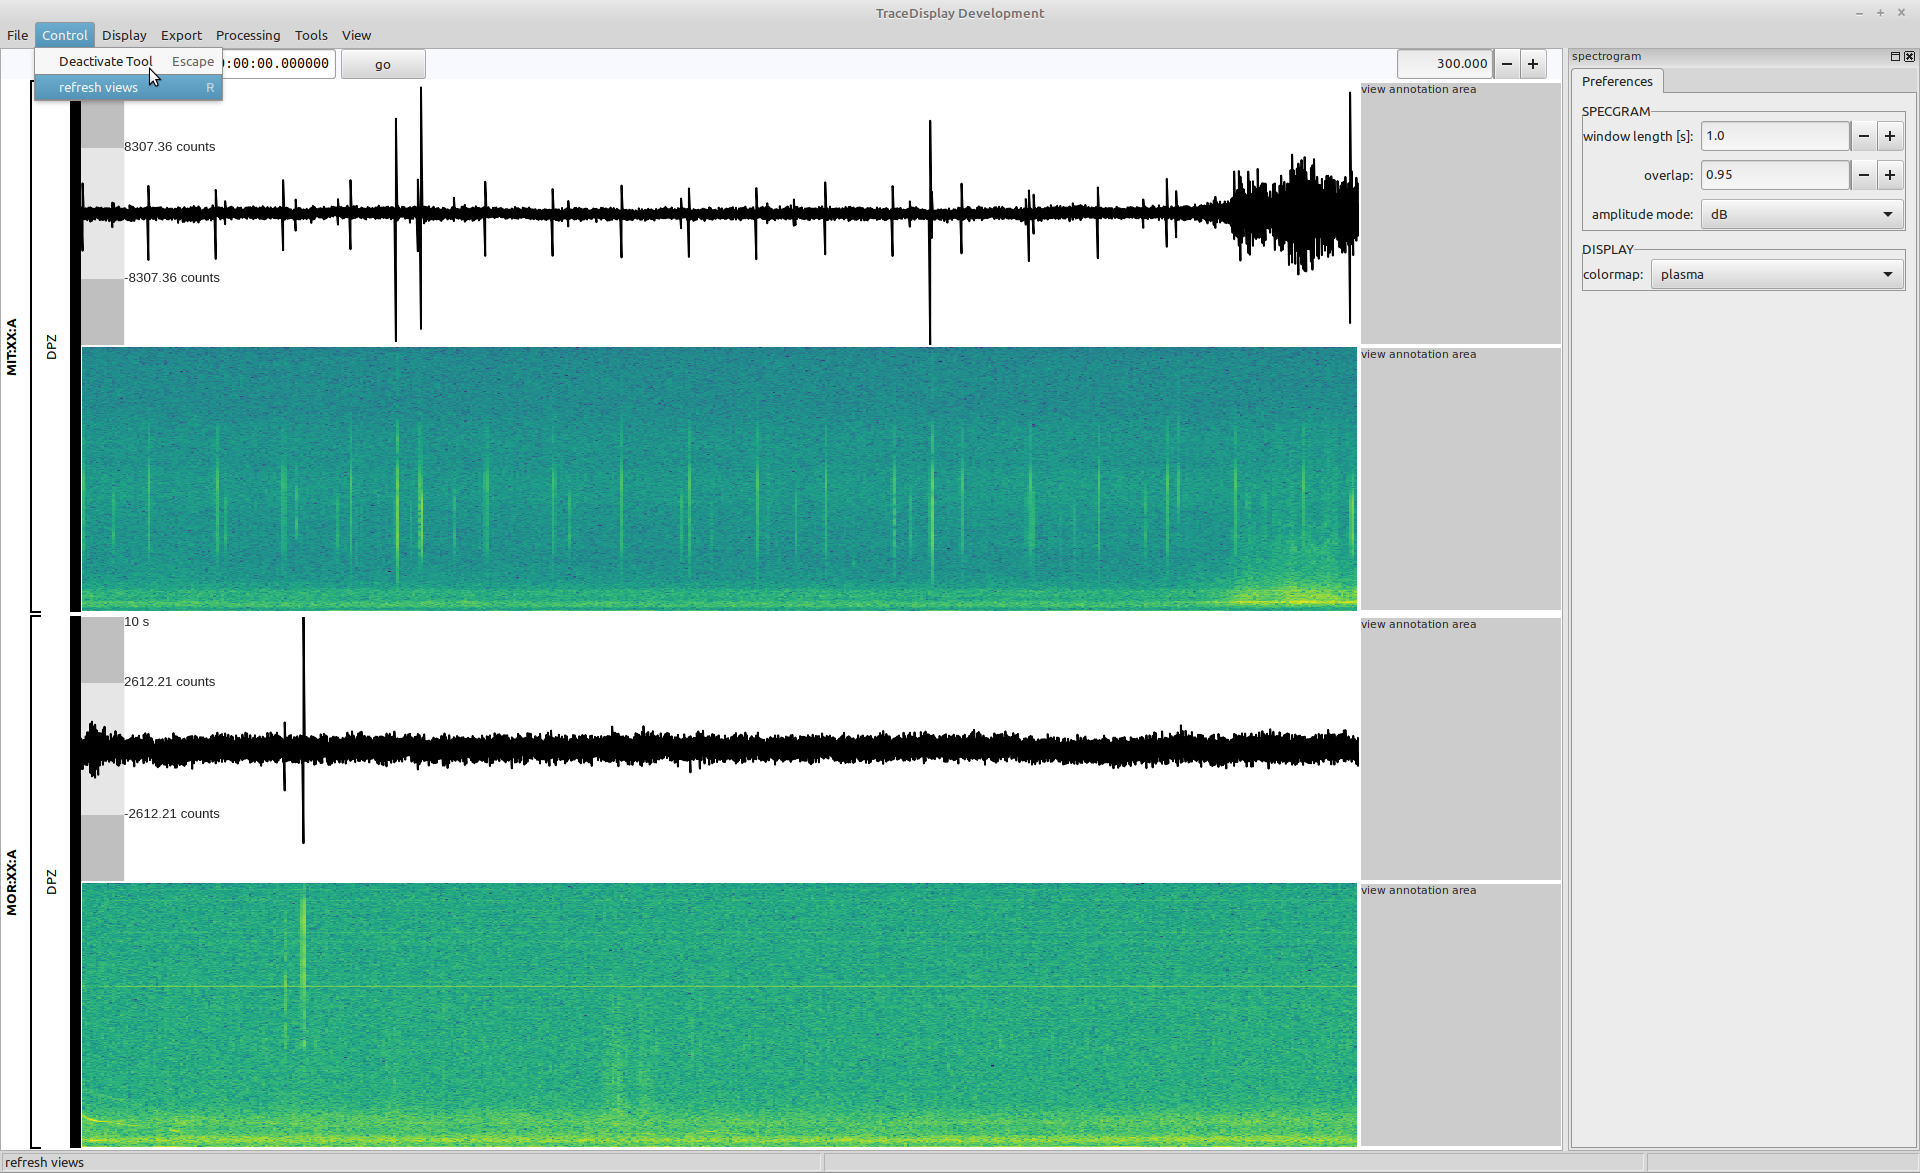
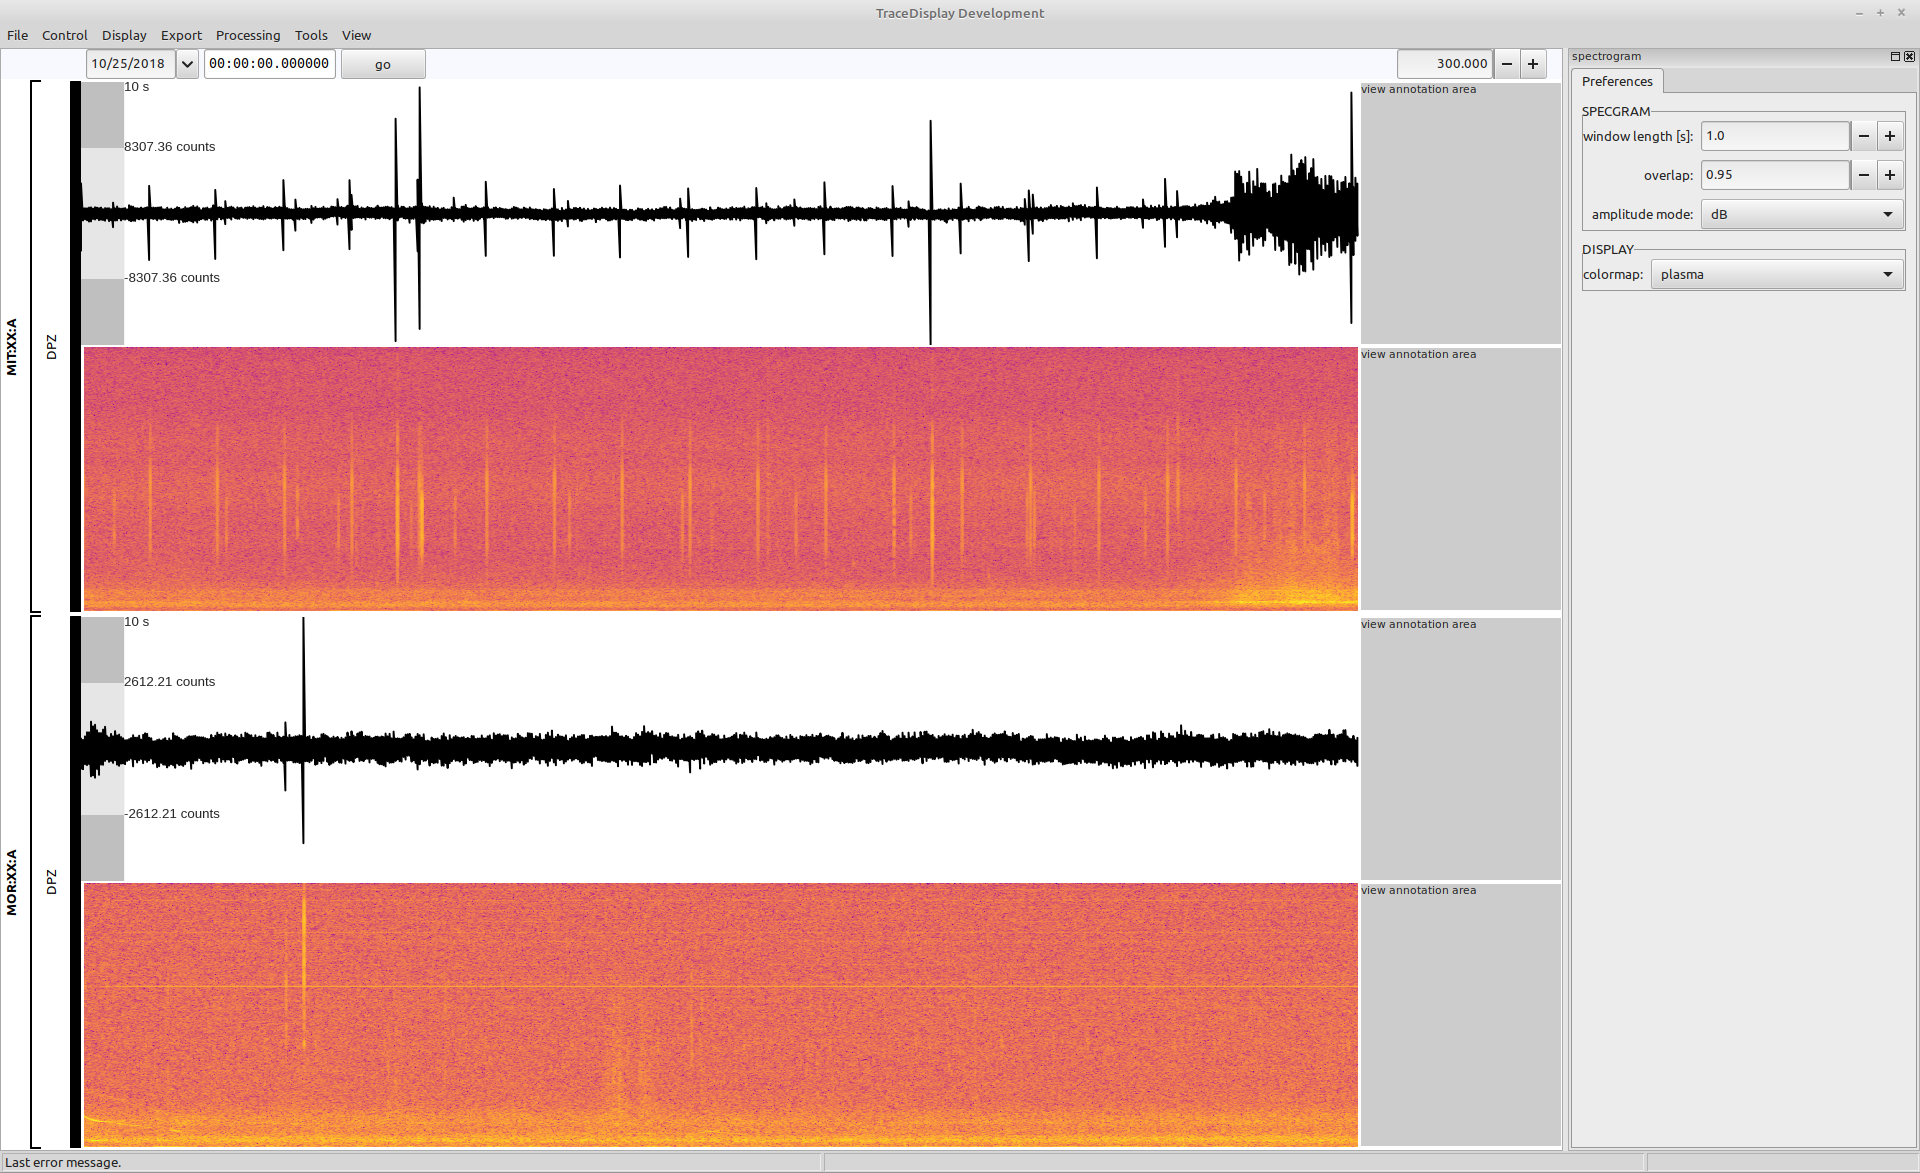
Use the editable preference elements in the preferences docking frame to change the settings of the plugin. In this example, I will change the overlap to 0.95 and the colormap to plasma. The changes will not be applied automatically. You have to refresh the views by using the Control->refresh views menu or the shortcut R.
The spectrogram views should be changed after refreshing the display.
The processing stack
The processing stack provides the possibility to add signal processing algorithms (e.g. detrending or frequency filtering) to the data before it is displayed. Close the spectrogram preferences (shortcut ALT-E) and open the processing stack (shortcut CTRL+P). The processing stack will be shown in a docking frame on the right side of the tracedisplay window.
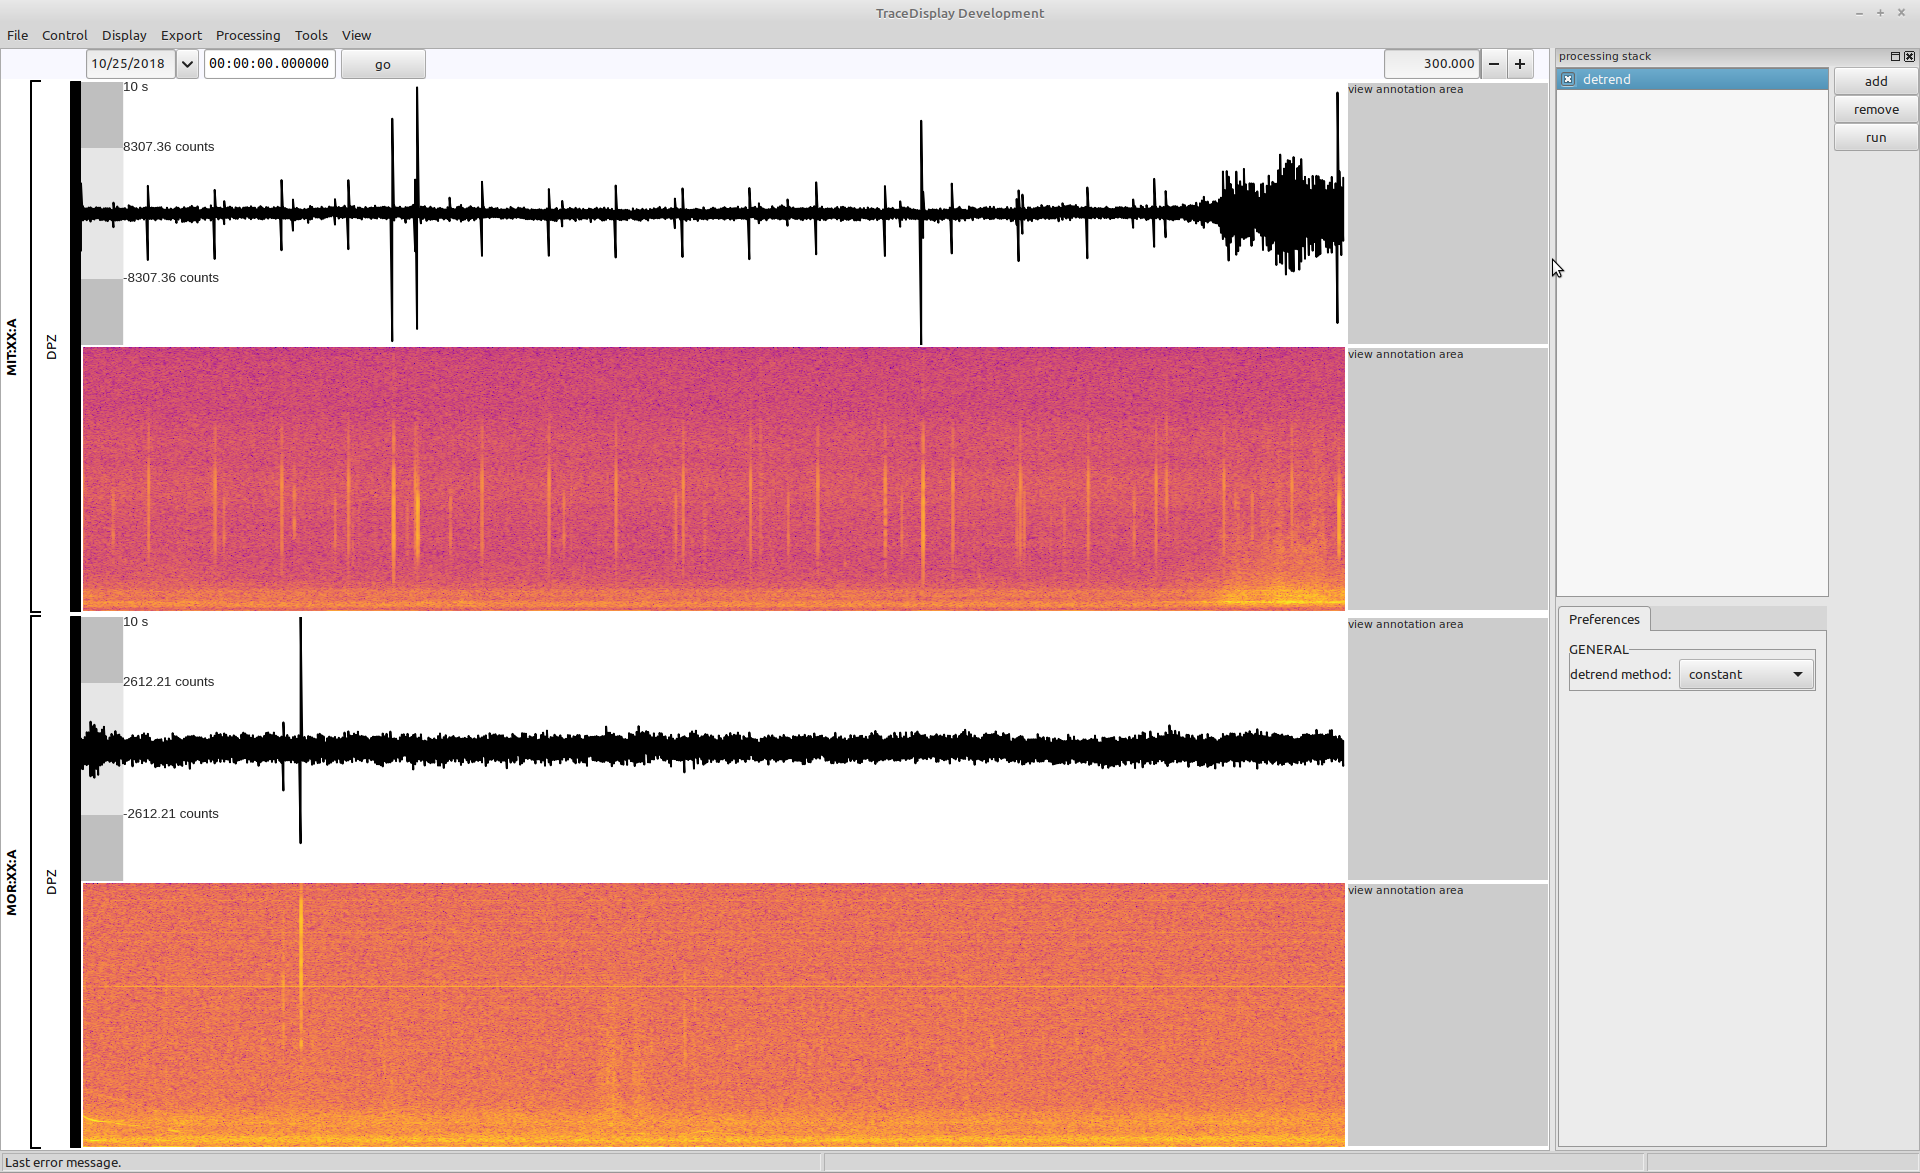
In the processing stack you can add processing nodes similar to collection nodes in a psysmon collection. The nodes in the processing stack will be applied to the original data from top to bottom. By default, the detrend processing node is activated. Each processing node provides preferences that can be edited below the processing stack node listbox.
Adding processing nodes
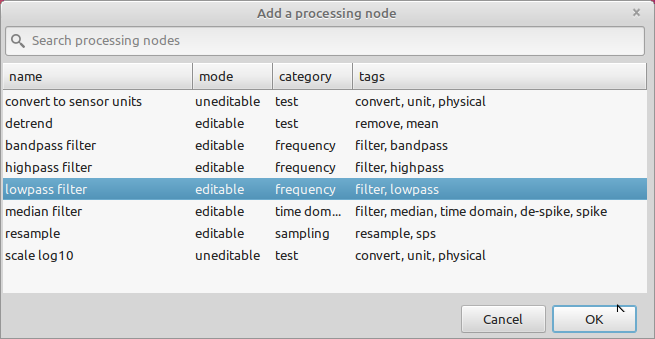
Click the add button in the processing stack docking frame. The processing nodes selection dialog will appear. Select the lowpass filter processing node in this dialog and click the OK button.
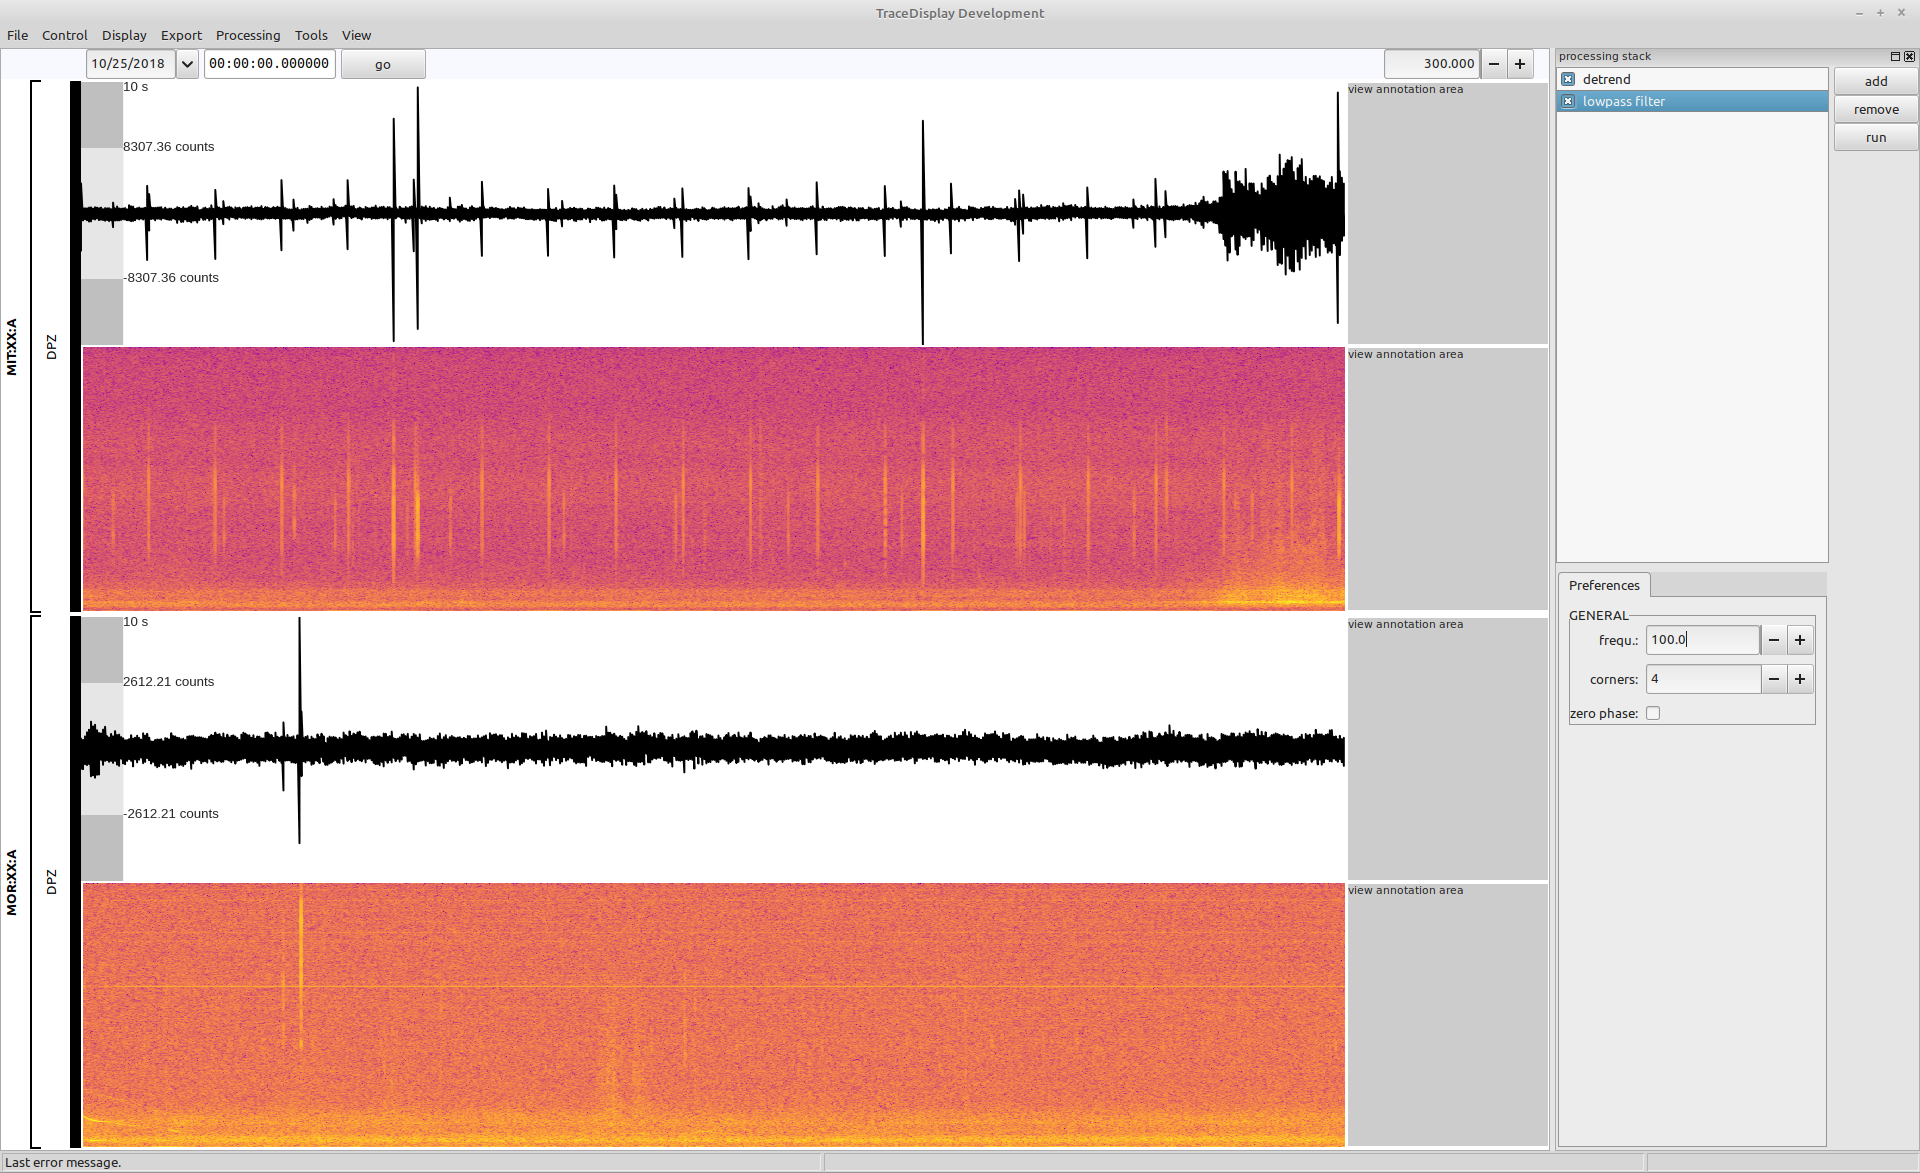
The lowpass filter processing node will appear in the processing stack below the detrend node. Select the lowpass filter node in the processing stack node listbox to open the preferences below the listbox. Change the frequ. parameter to 100.
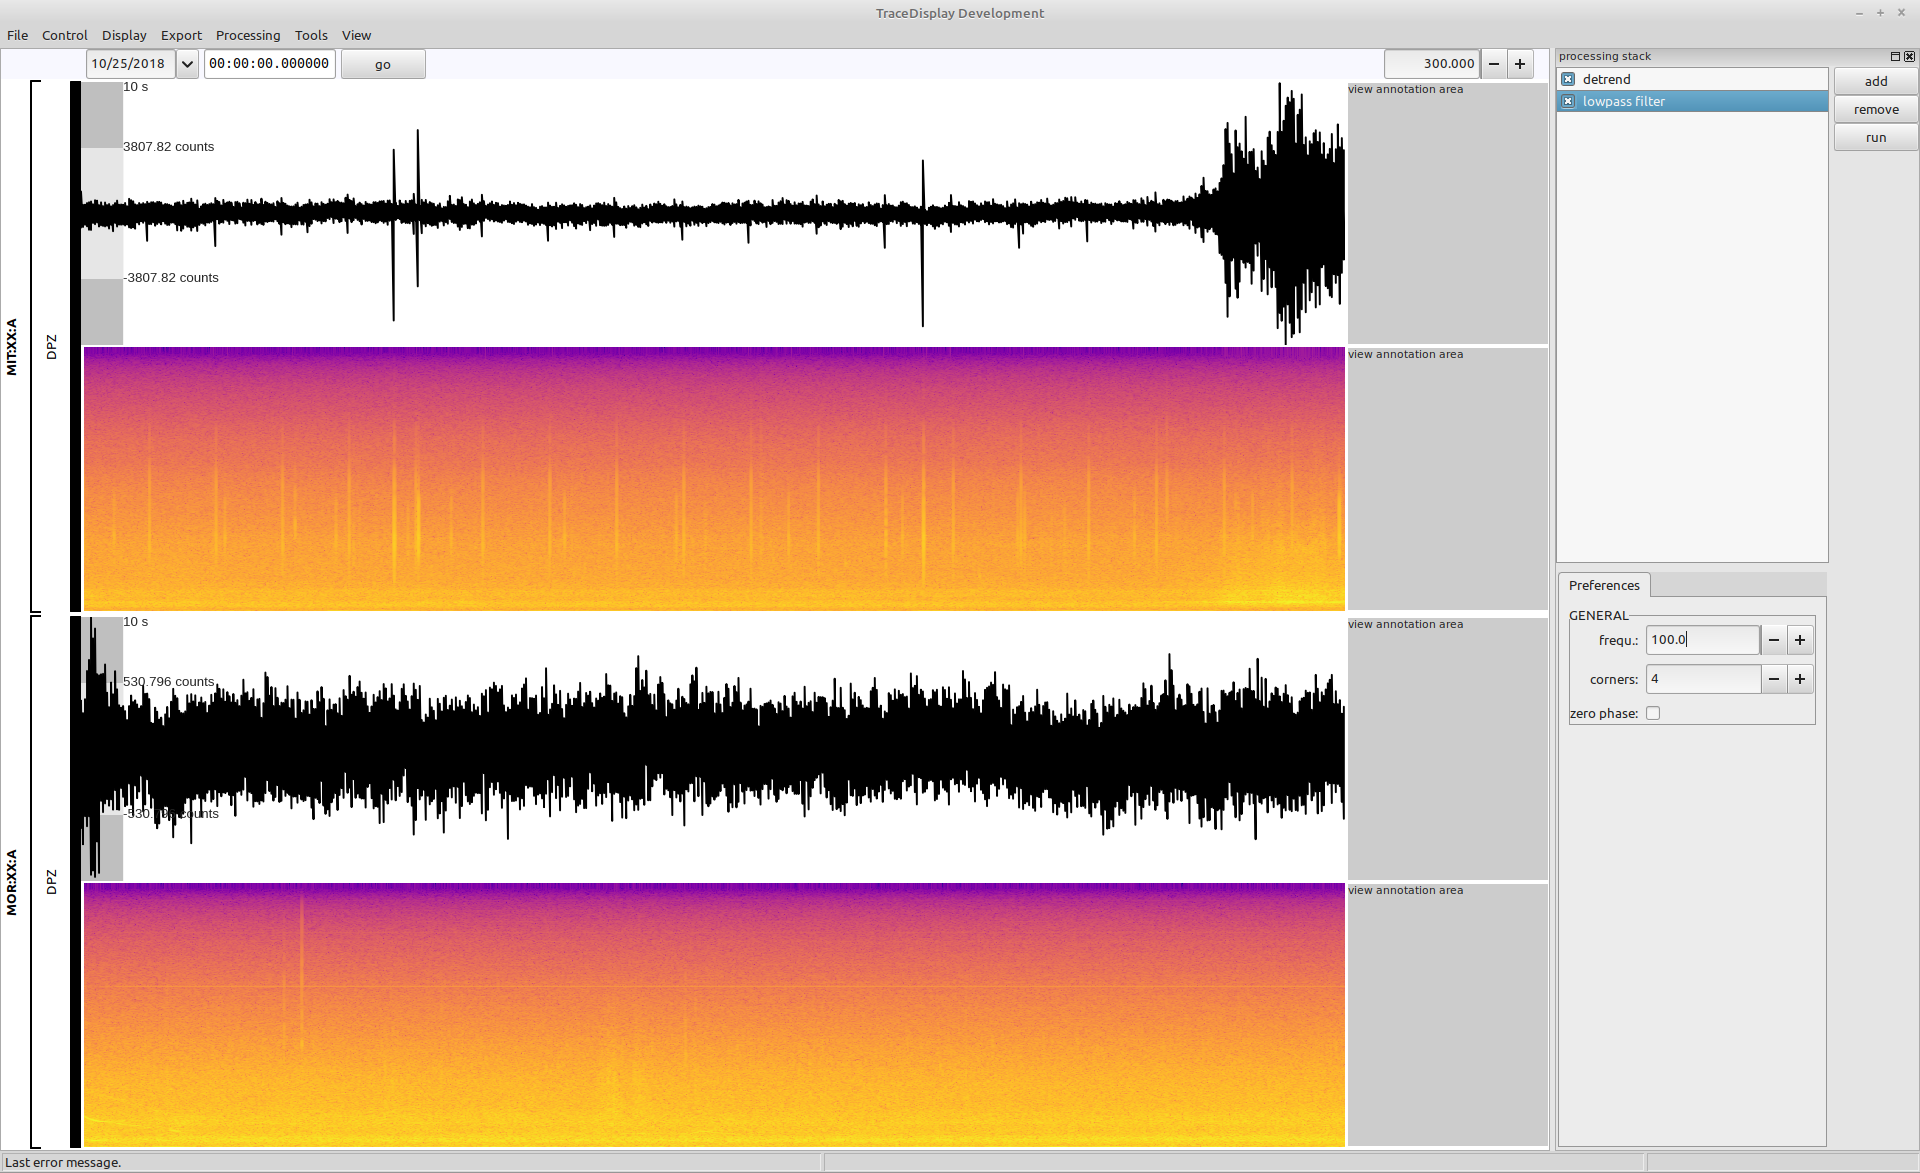
To apply the changed processing stack to the data, either click the run button in the processing stack docking frame or refresh the tracedisplay views using the shortcut R.
The tracedisplay view is updated showing the data with the 100 Hz lowpass filter applied.

Copyright © 2022 Stefan Mertl.
This article is licensed under a Creative Commons Attribution-ShareAlike 4.0 International license.
You are allowed to share the material, that means to copy and redistribute the material in any medium or format as long as you give appropriate credit to the creator and add the link to the license. You are allowed to adapt, that means to remix, transform, and build upon the material. If you adapt the material, you must distribute your contributions under the same license as the original.
If possible, please cite this article using the following form:
Psysmon Documentation, Sonnblick Events, "Data screening", Stefan Mertl, 2022-08-27, www.mertl-research.at, licensed under CC BY-SA 4.0