Getting an overview of the available data.
Data availability
On this page
Create the availability collection
Create a collection named availability and add the two collection nodes data inventory statistics and data availability to the collection. Next disable the collection node data availability. You can disable the collection node by first selecting the node data availability in the collection listbox and than clicking the menu entry disable node from the context menu in the collection listbox.
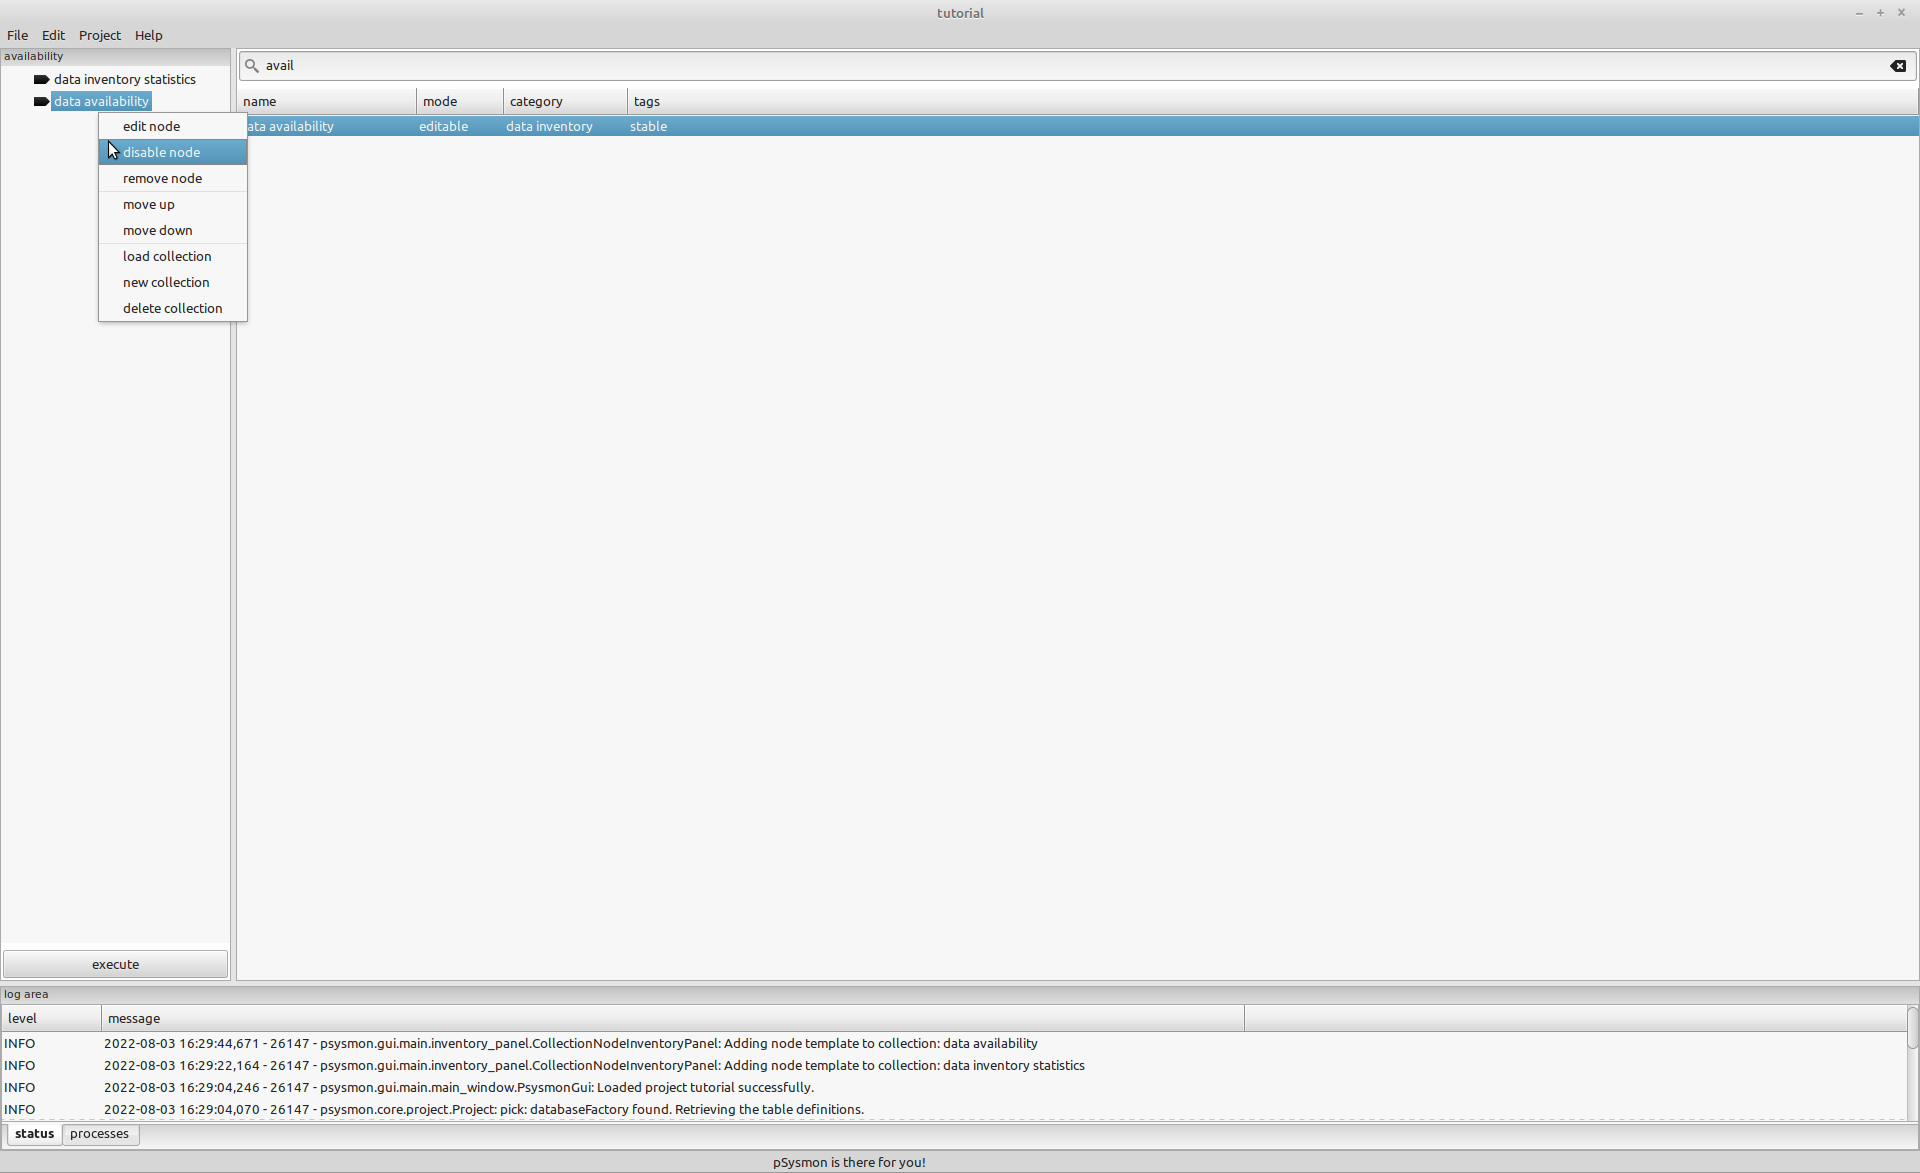
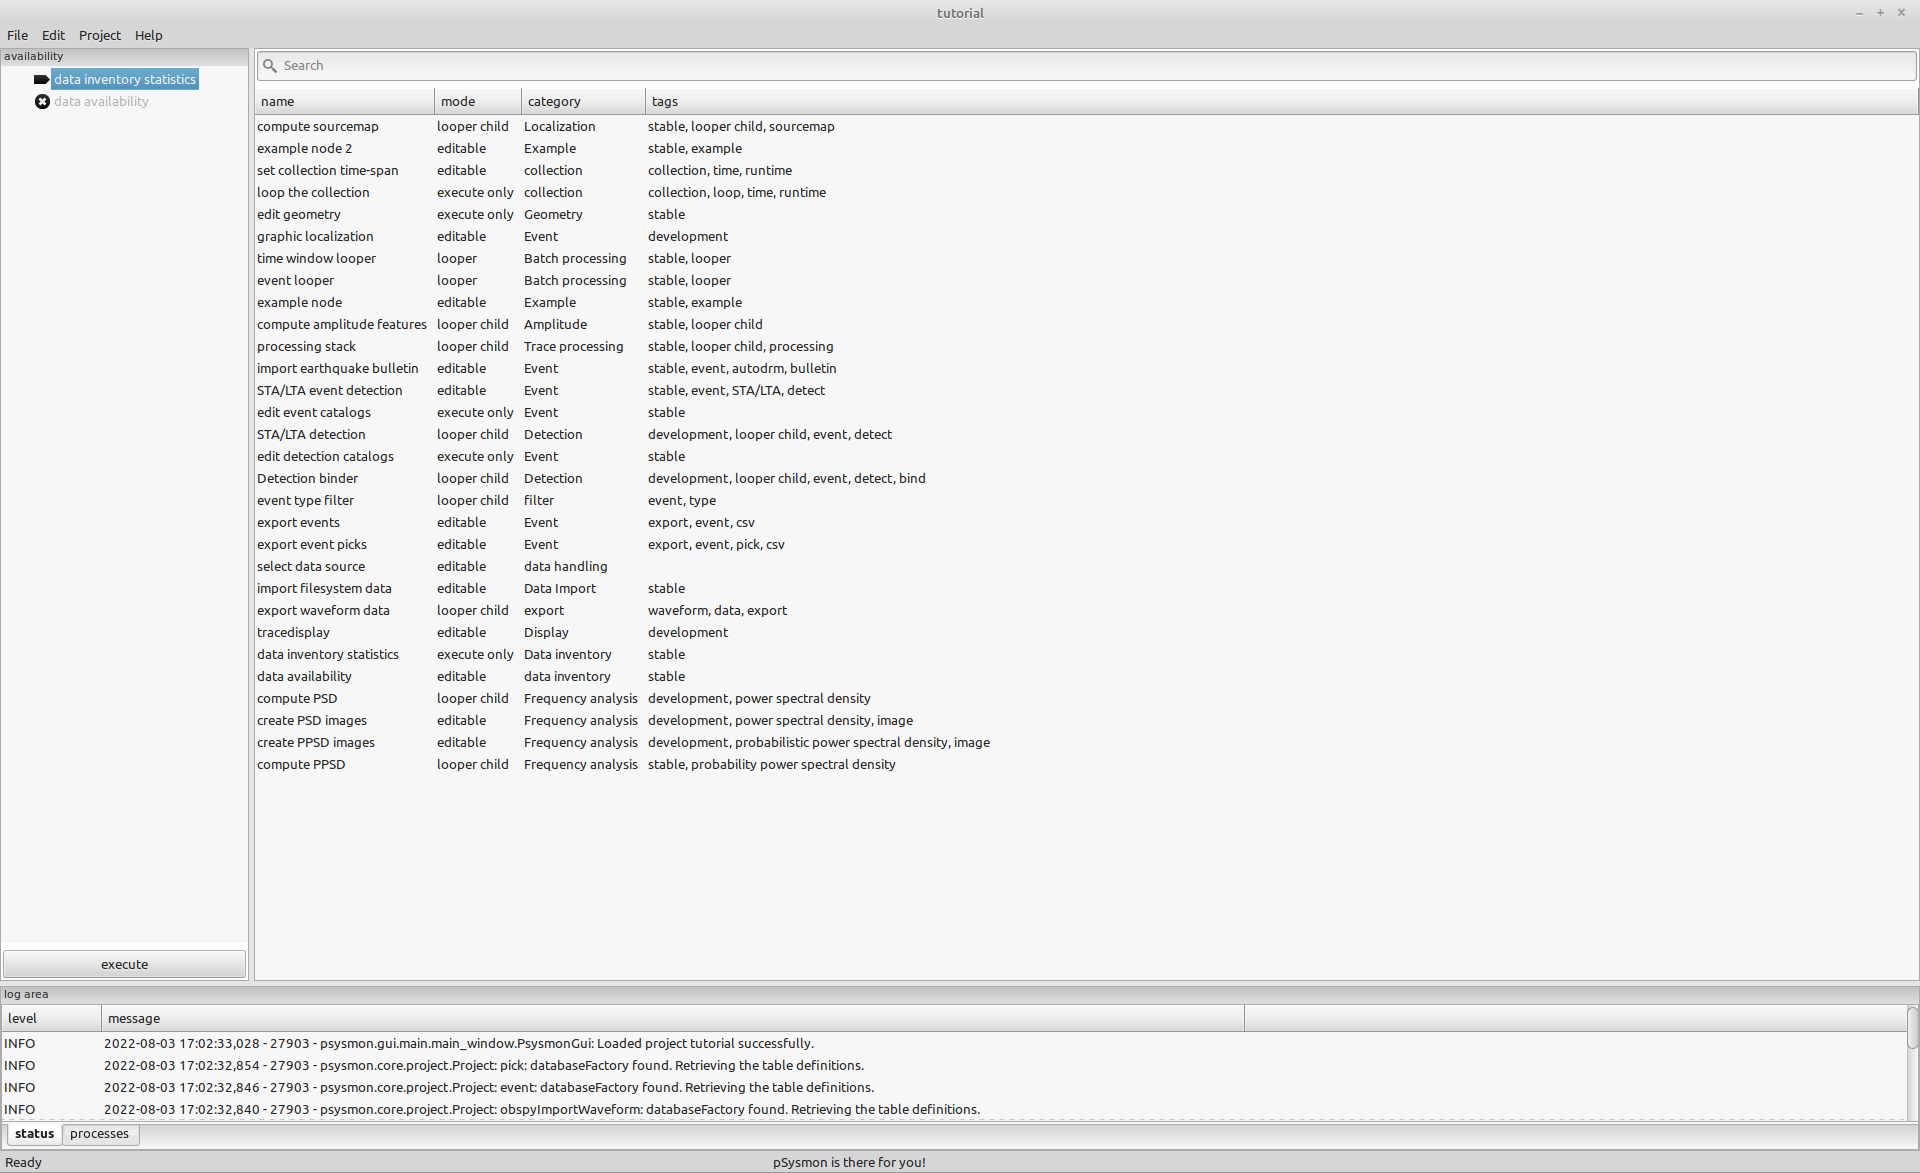
The name of the disabled collection node will appear in a light gray color and the icon of the node will be changed to a cross. A disabled collection node will be ignored when executing the collection.
Display the inventory statistics
Execute the collection with the data availability node disabled to open the inventory statistics dialog. This is a simple dialog showing some statistics of the database data inventory. Currently only the text view is available which shows a dictionary with the content available in the database. This overview can be used to evaluate, if the imported data has the expected content (e.g. all required recorder serials are available, the number of data files look reasonable, …).
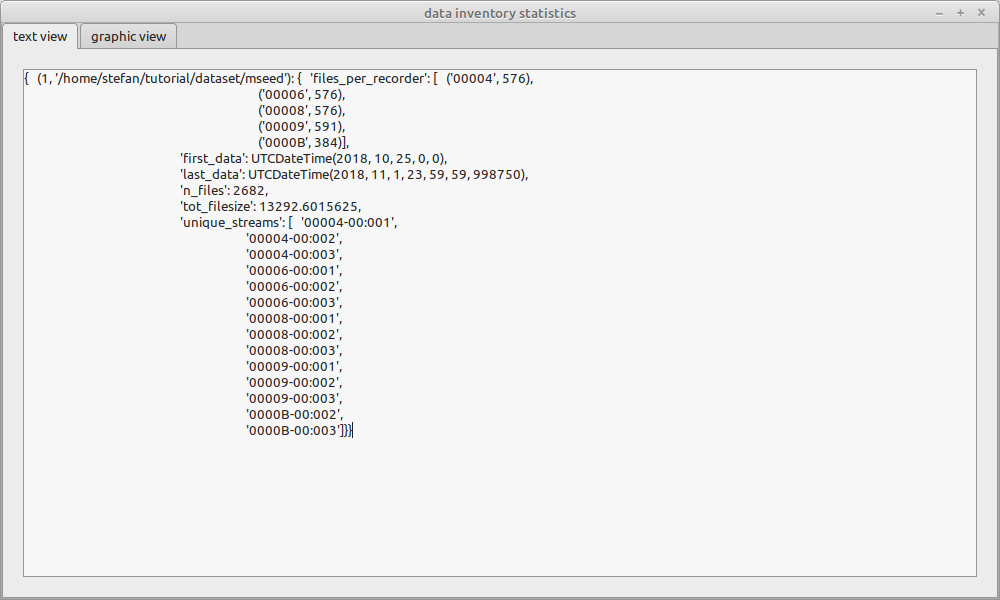
Keep the window open, we will need the information for the next step.
Create data availability plots
Create an output directory
The data availability node creates images with diagrams showing the available data of selected station components and time spans. The images are saved in a directory that has to be specified in the collection node preferences. I created an output directory named psysmon_output/availability in the tutorial directory. This directory will be used to save the images created by the execution of the data availability node.
stefan@hausmeister:~/tutorial$ ls
dataset  psysmon  psysmon_projects  venv
stefan@hausmeister:~/tutorial$ mkdir psysmon_output
stefan@hausmeister:~/tutorial$ cd psysmon_output
stefan@hausmeister:~/tutorial/psysmon_output$ mkdir availability
stefan@hausmeister:~/tutorial/psysmon_output$ cd ..
stefan@hausmeister:~/tutorial$ tree -L 1
.
├── dataset
├── psysmon
├── psysmon_output
├── psysmon_projects
└── venv

5 directories, 0 files
stefan@hausmeister:~/tutorial$ tree psysmon_output
psysmon_output
└── availability

1 directory, 0 files
stefan@hausmeister:~/tutorial$
Enable the data availability collection node
Enable the data availability node and disable the data inventory statistics node using the context menus.
Edit the collection node preferences
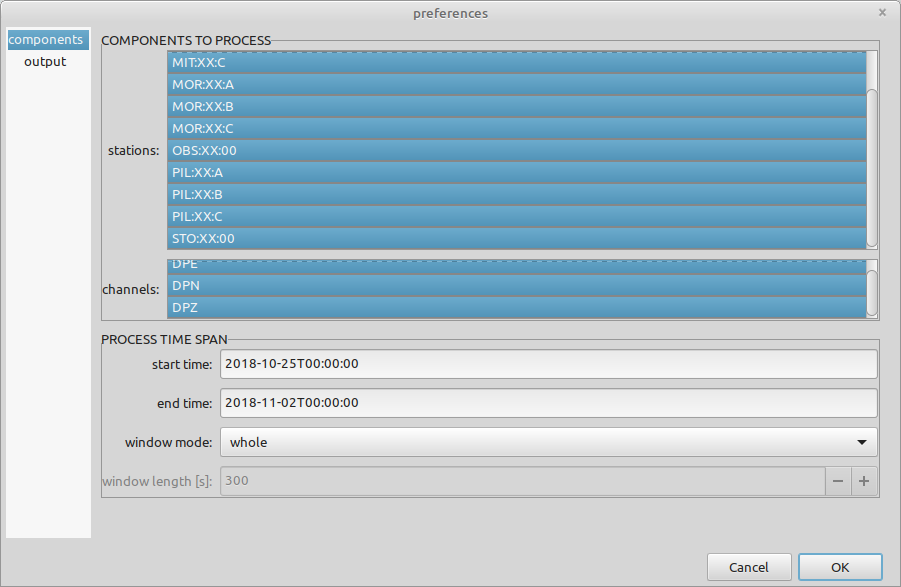
Before executing the collection, the preferences of the data availability collection node have to be set. Open the collection node preferences by selecting the data availability node and clicking the menu entry edit node in the context menu. The preferences dialog of the selected collection node opens. Select all stations and channels to process and set the process time span according to the limits given in the data inventory statistics dialog. The start time is 2018-10-25T00:00:00 and the end time is 2019-11-02T00:00:00. Set the window mode to whole. After that, close the data inventory statistics dialog.
The window mode preference can be used to specify the time span into which the whole time span should be split. For each time window (e.g. daily, weekly,…) an individual availability image will be created. The range of the tutorial data set is not long, so we will plot the data availability of the complete time span.
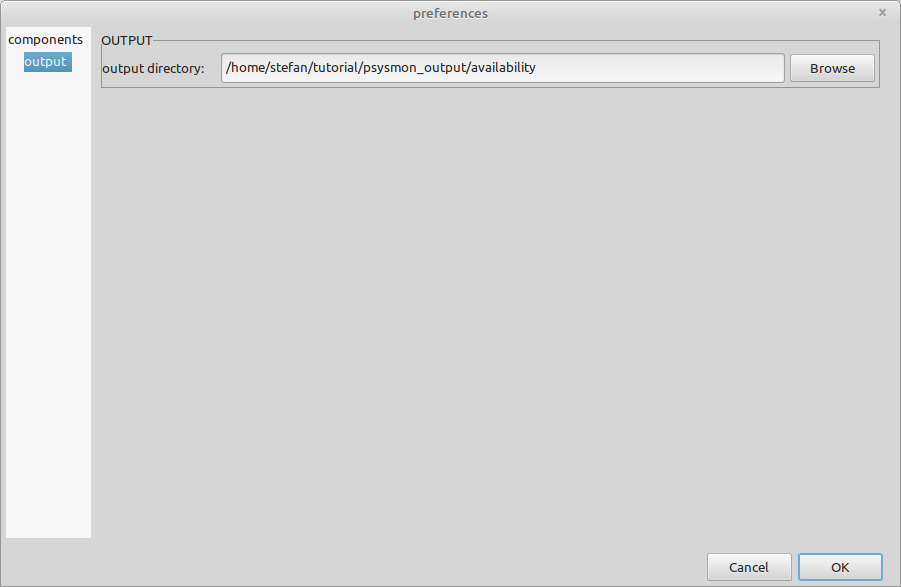
The output directory /home/stefan/tutorial/psysmon_output can be set in the output page of the preferences dialog (change the file path to fit the output path on your file system). The list of available pages is given in the listbox at the left side of the preferences dialog.
The settings in the preferences manager should look like in the following two screenshots. Confirm the settings and close the preferences dialog by clicking the OK button.
Execute the collection
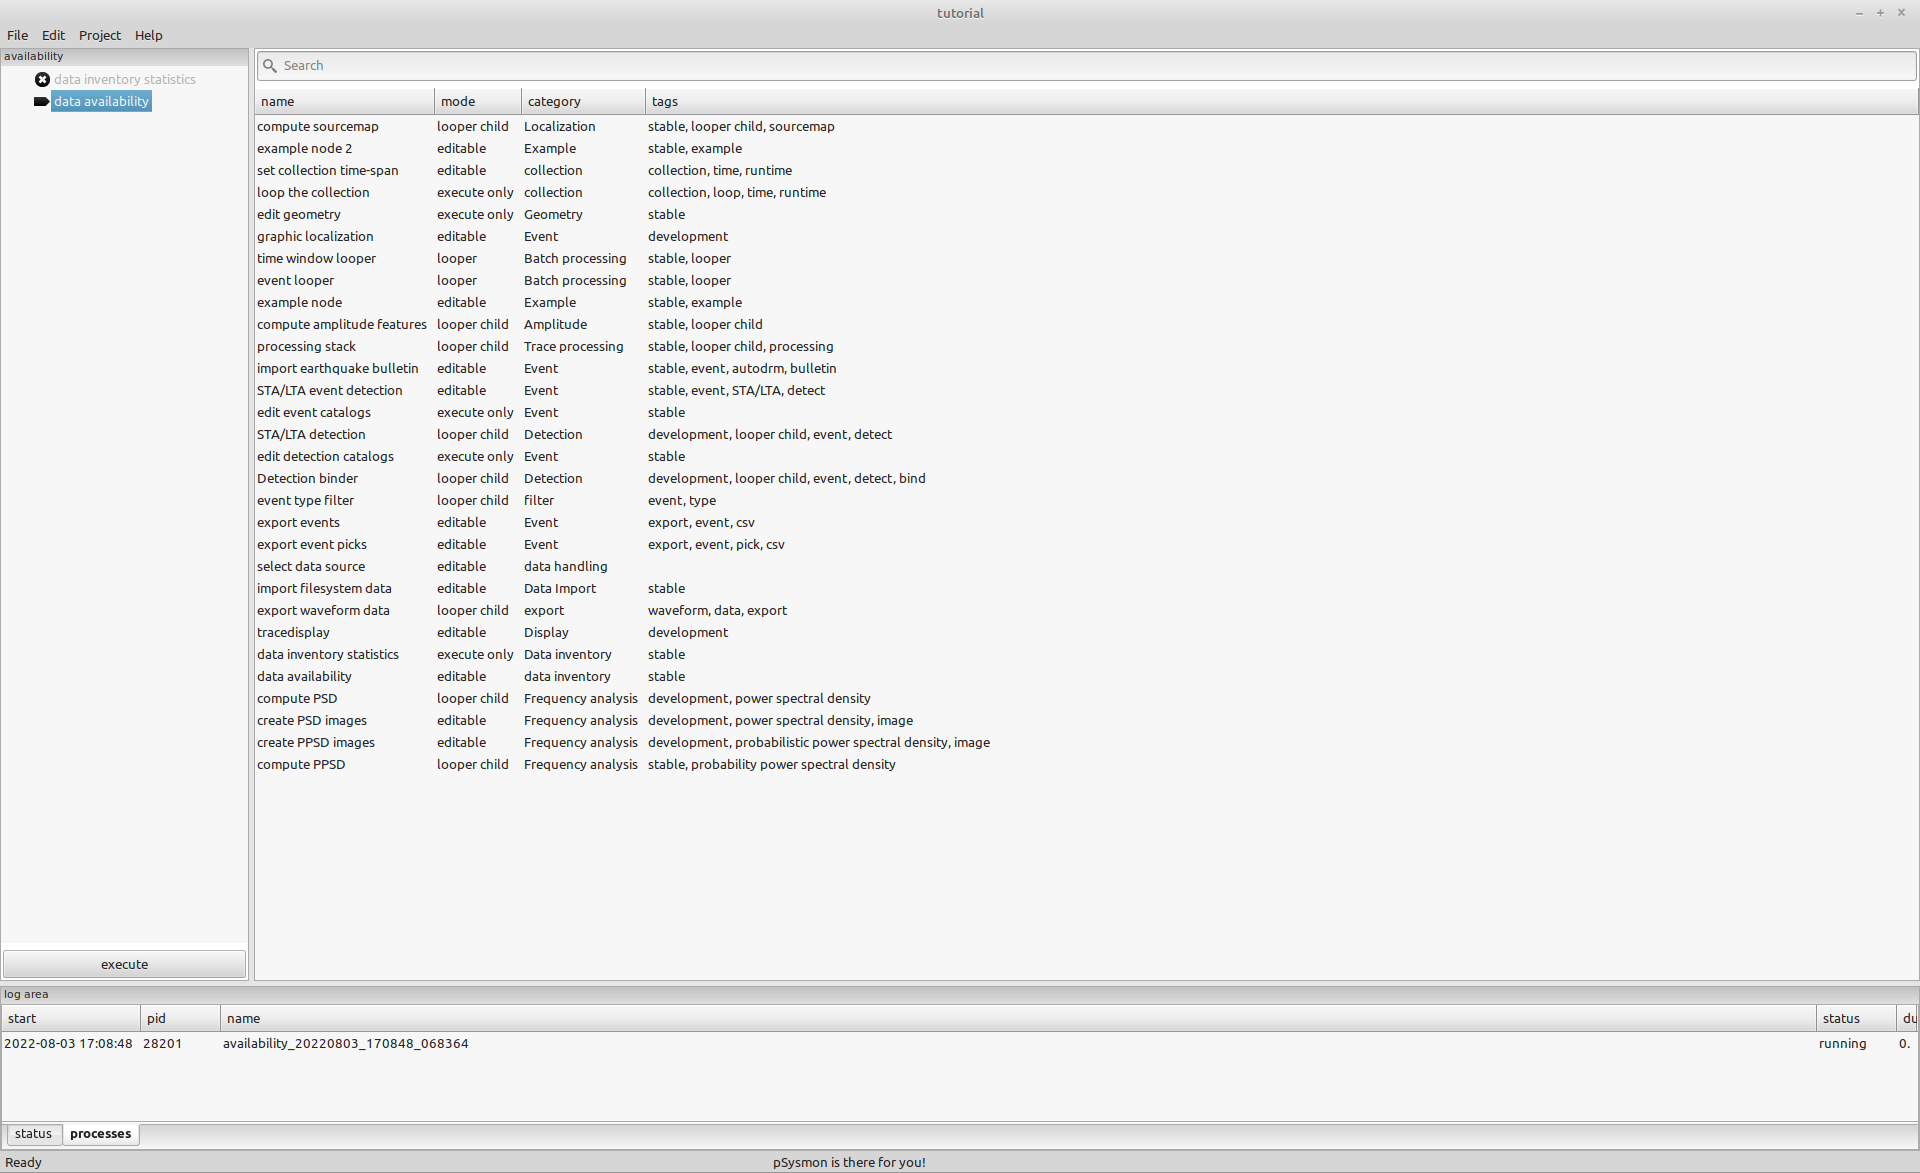
After the execution of the collection was started, no dialog window will appear. The data availability node only creates images in the specified output directory. You can check the status of the process in the processes tab of the log area in the psysmon main window.
Don’t forget to save the project.
Checking the availability plots
The results of a collection node will always be placed in a unique folder named using the uniform resource identifier of the collection and the timestamp of the execution. This prevents that results are overwritten when executing the same collection repeatedly (e.g. with changed preferences).
The following listing shows the data structure created when executing the above collection.
stefan@hausmeister:~/tutorial/psysmon_output$ tree -L 3
.
└── availability
    └── smi-mr.sm-psysmon-tutorial-availability_20220803_175105_997754-data_availability
        └── data_availability_20181025_000000_20181102_000000.png

2 directories, 1 file
stefan@hausmeister:~/tutorial/psysmon_output$
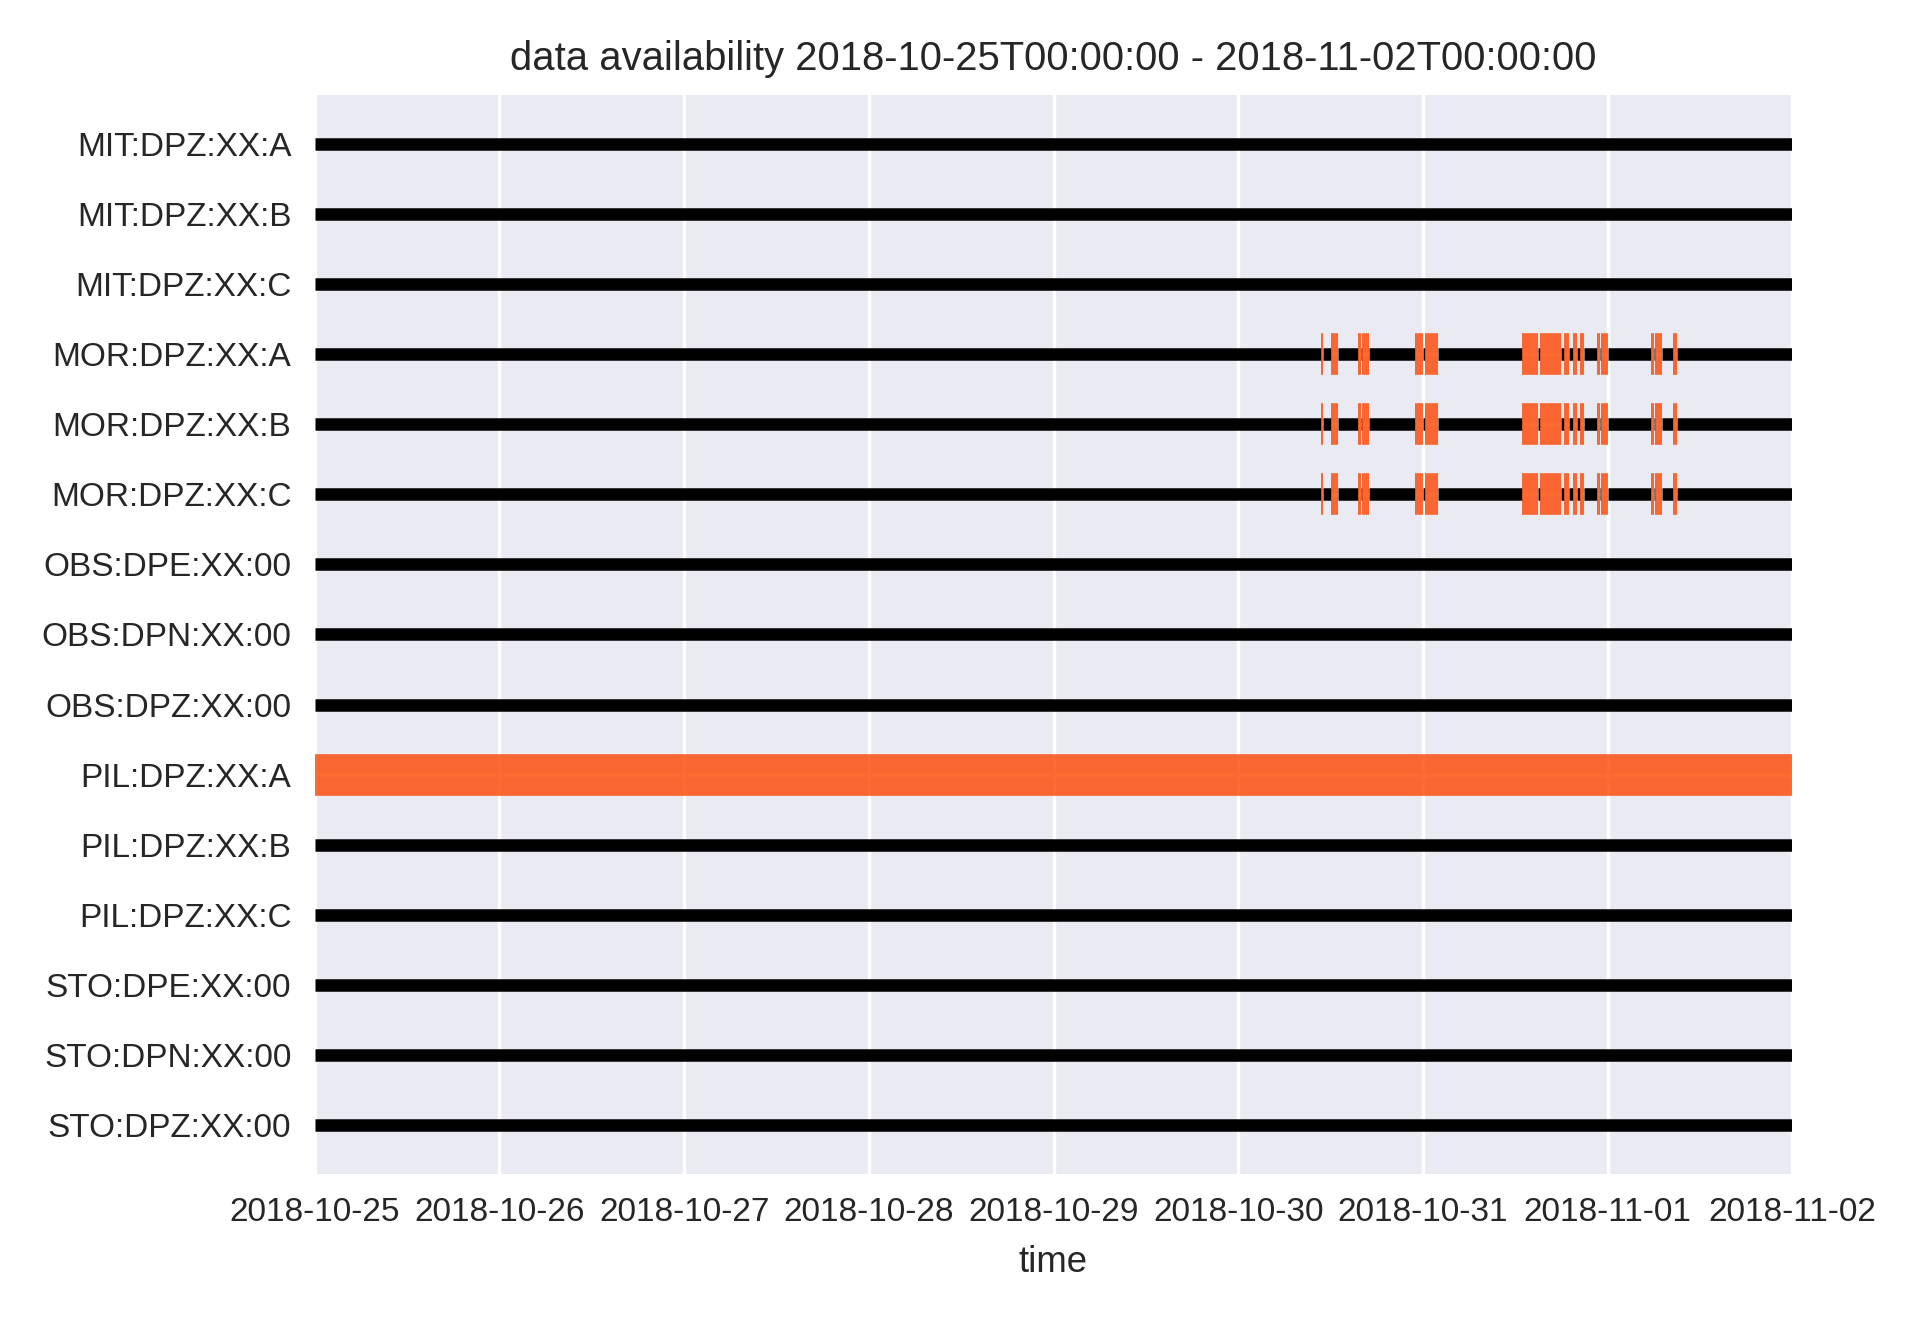
The resulting image data_availability_20181025_000000_20181102_000000.png shows the available data of the tutorial data set. Black lines mark the time when data is available in the database, broad orange-red lines mark time ranges when no data is available. It can be seen, that station PIL:DPZ:XX:A has no data for the complete time span and array MOR has some short data gaps from 2018-10-30 on.

Copyright © 2022 Stefan Mertl.
This article is licensed under a Creative Commons Attribution-ShareAlike 4.0 International license.
You are allowed to share the material, that means to copy and redistribute the material in any medium or format as long as you give appropriate credit to the creator and add the link to the license. You are allowed to adapt, that means to remix, transform, and build upon the material. If you adapt the material, you must distribute your contributions under the same license as the original.
If possible, please cite this article using the following form:
Psysmon Documentation, Sonnblick Events, "Data availability", Stefan Mertl, 2022-08-27, www.mertl-research.at, licensed under CC BY-SA 4.0