Exporting the events and the event data.
Event export
On this page
The events and detections saved in the psysmon database can be exported to a CSV file for further data analysis. Additionally, psysmon supports the export of the waveform data of the events.
Create the output directories
For the event export you should create two output directories in the tutorial directory structure: event_list and event_data
stefan@hausmeister:~/tutorial$ cd psysmon_output
stefan@hausmeister:~/tutorial/psysmon_output$ mkdir event_list
stefan@hausmeister:~/tutorial/psysmon_output$ mkdir event_data
stefan@hausmeister:~/tutorial/psysmon_output$ tree -L 1
.
├── availability
├── event_data
├── event_list
├── ppsd
├── psd_data
└── psd_images

6 directories, 0 files
stefan@hausmeister:~/tutorial/psysmon_output$
Export the event lists
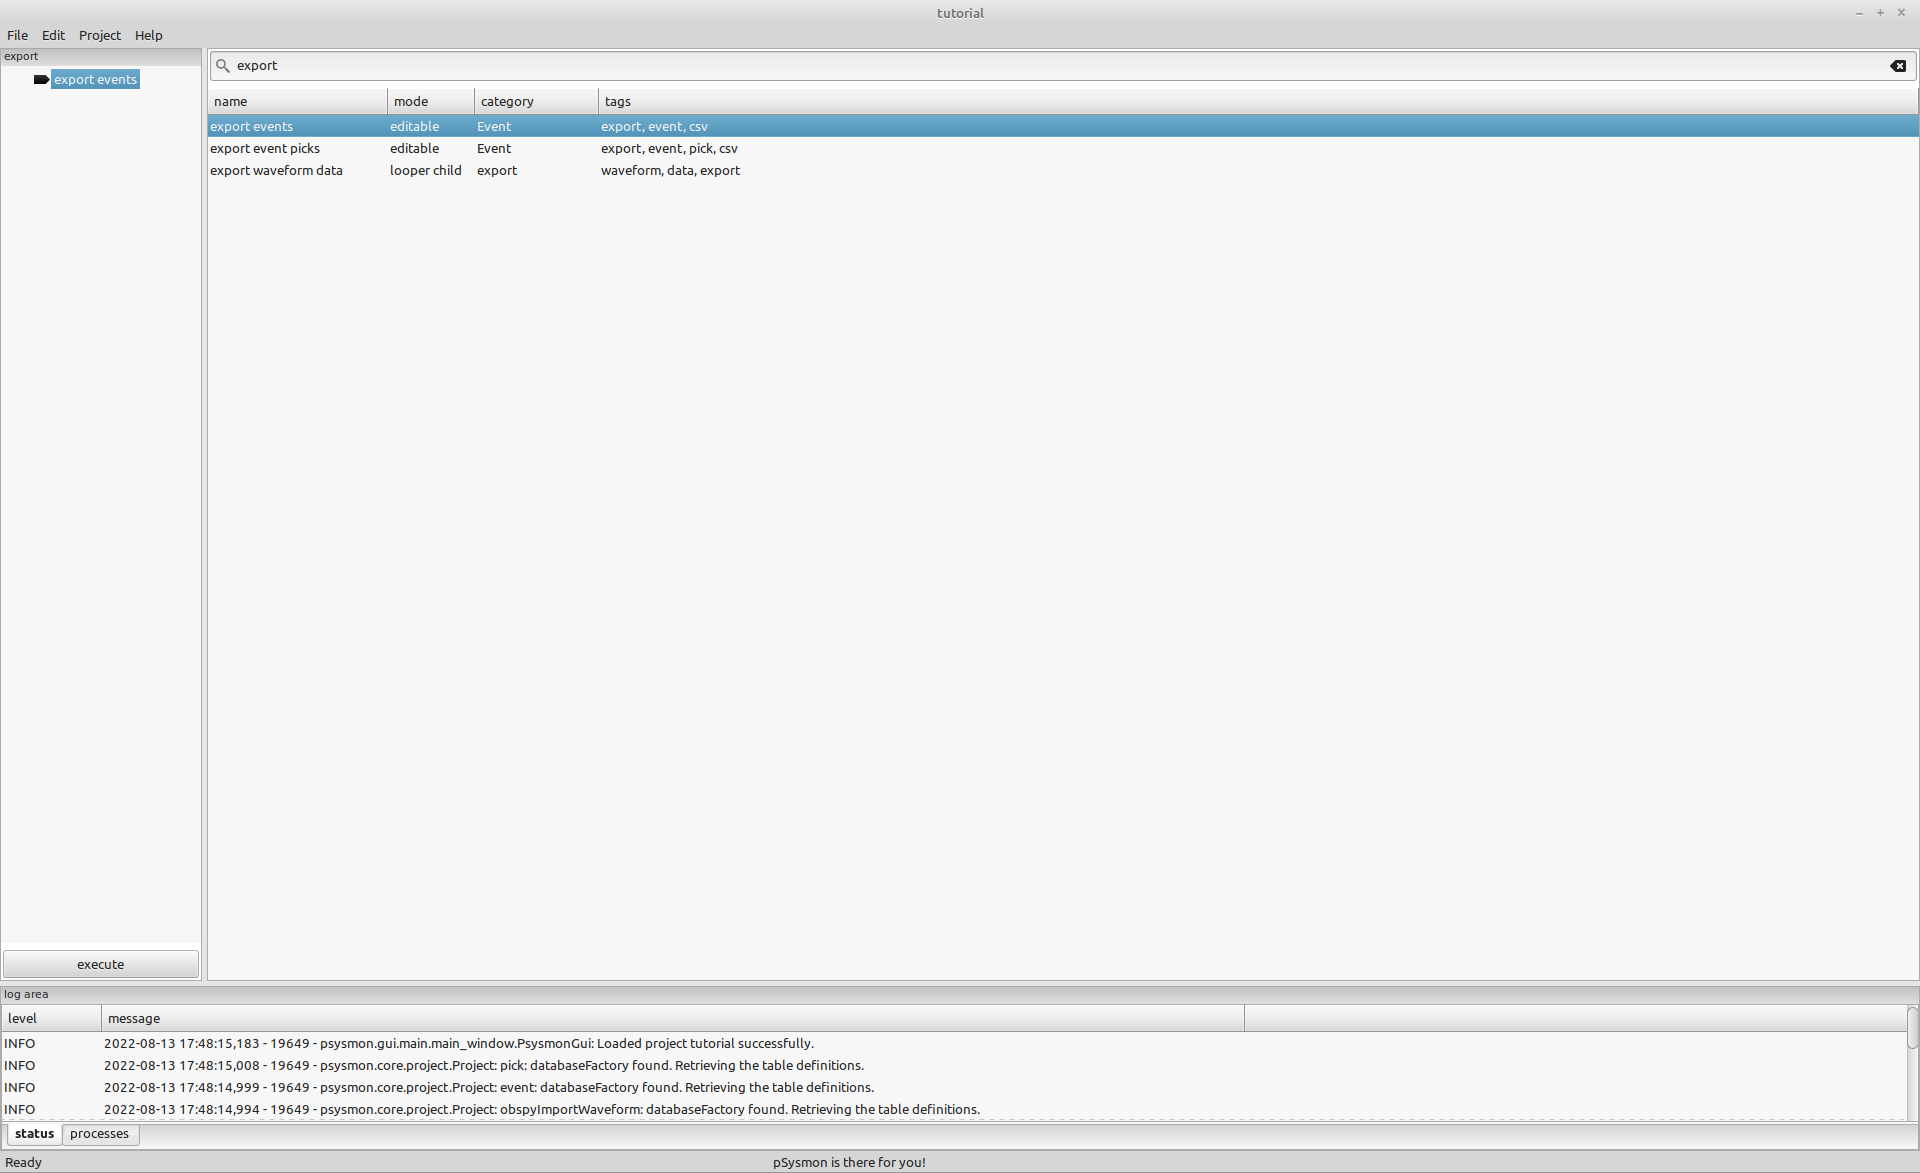
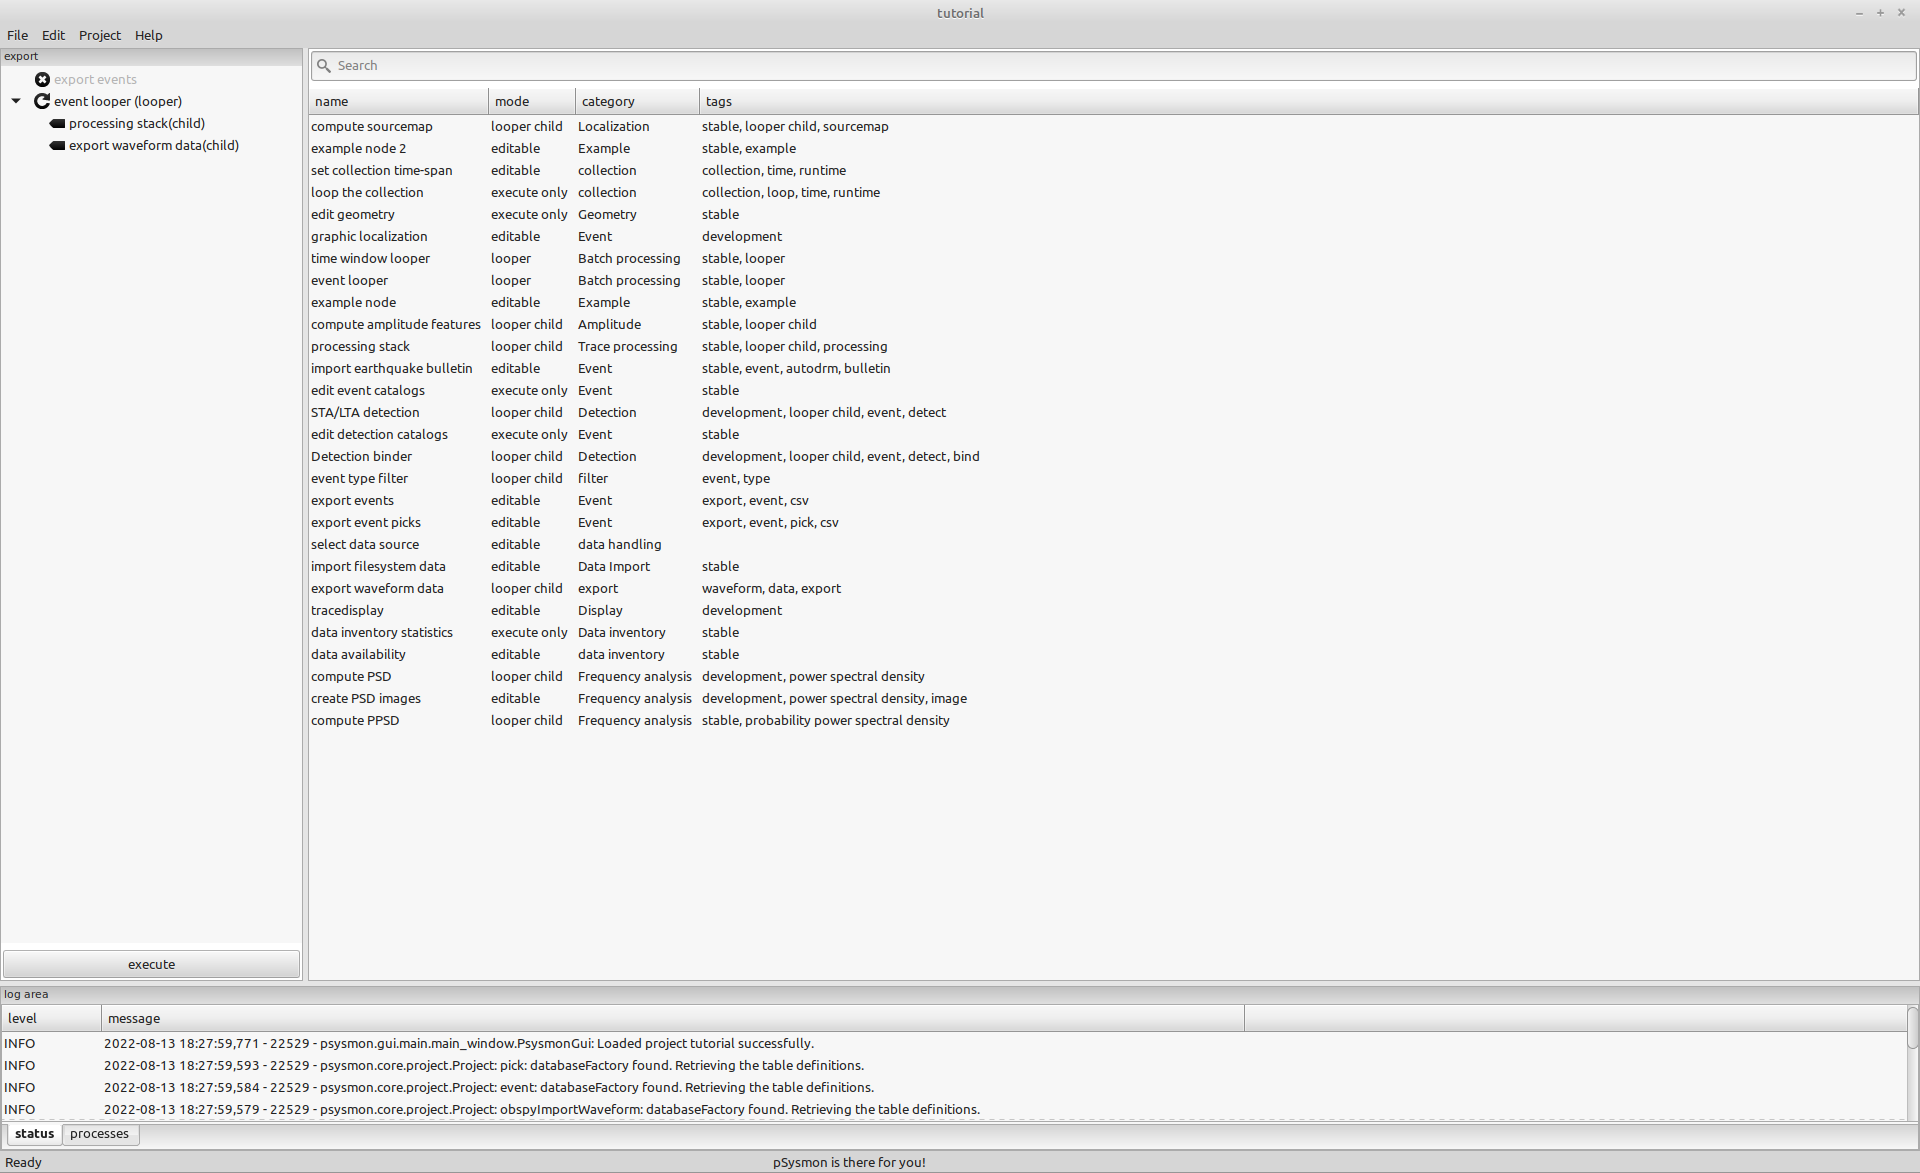
To export the event lists, first create a new collection named export and add the export events collection node. The export events node creates a list of events and a list of the related detections for a selected time span.
Configure the export events node
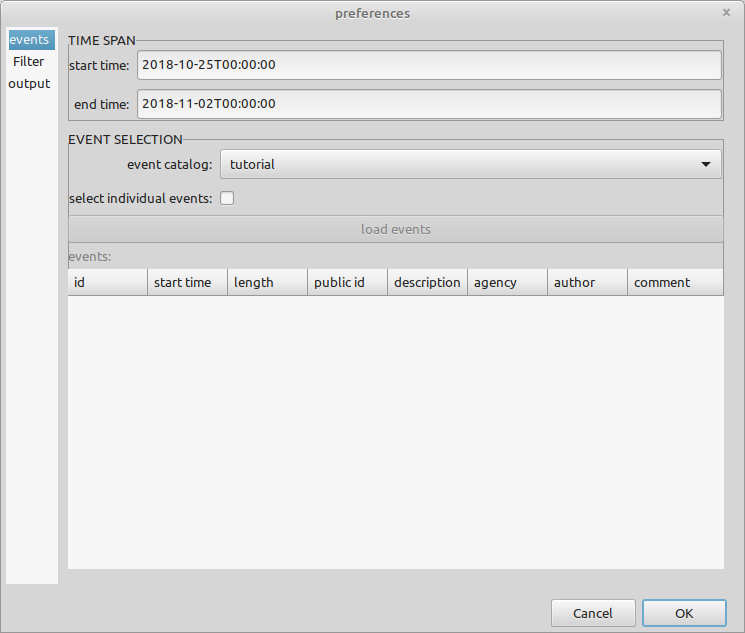
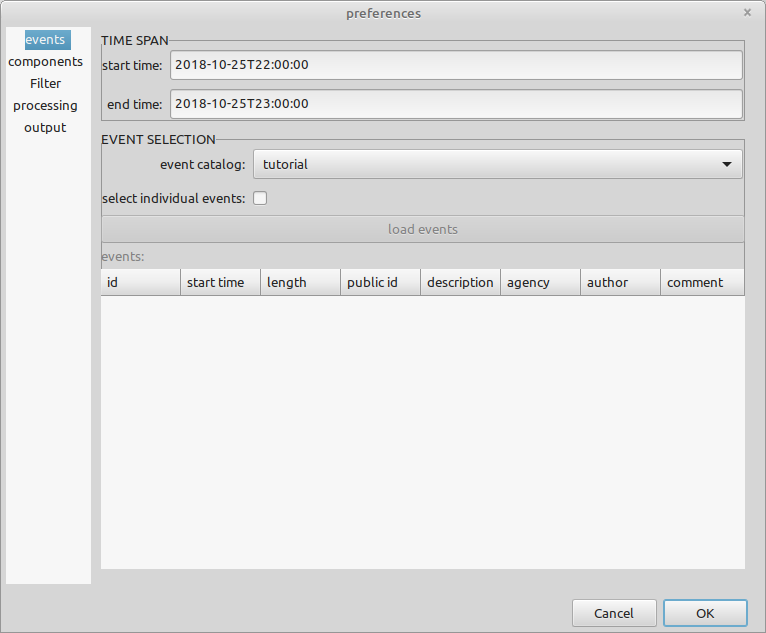
Open the export events preferences dialog and edit the settings.
event
Select the whole time span of the tutorial data set and the tutorial event catalog to export.
| parameter | value |
|---|---|
| start time | 2018-10-25T00:00:00 |
| end time | 2018-11-02T00:00:00 |
| event catalog | tutorial |
| select individual events | unchecked |
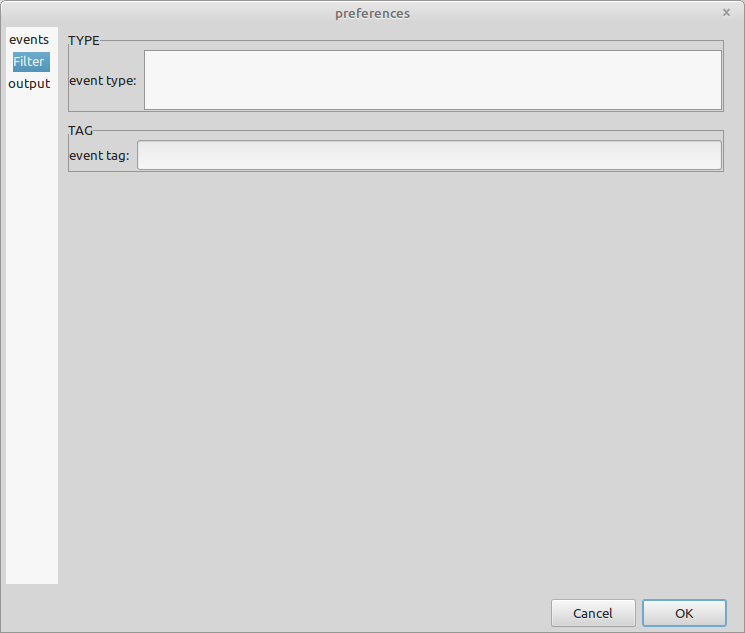
Filter
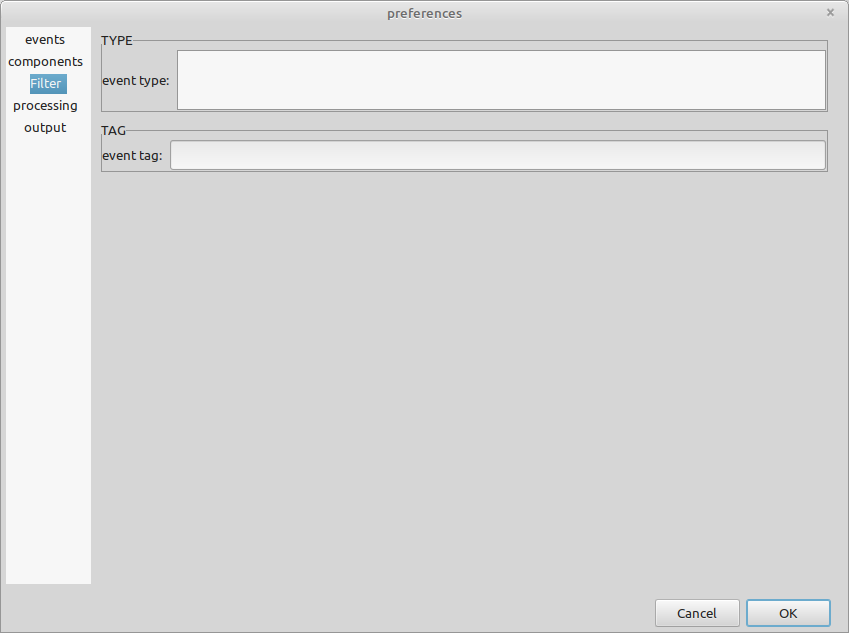
Leave the filter settings unchanged.
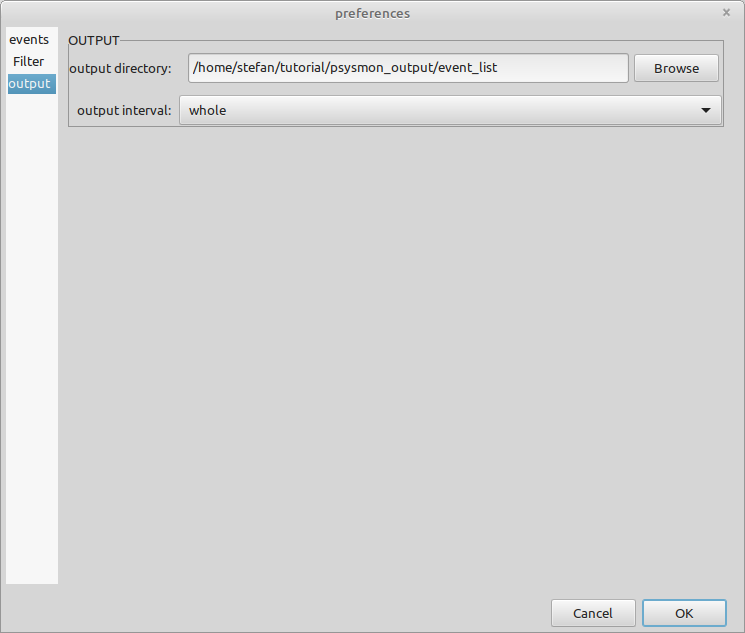
output
Select the event_list folder created above and whole for the output interval. The output interval determines the splitting of the output to individual files. Using whole will create one file for all events and detections.
Close the preferences dialog.
Export the events to CSV files
Click the execute button to run the collection. The CSV files of the event- and detection list will be created in the specified output directory.
stefan@hausmeister:~/tutorial/psysmon_output$ cd event_list
stefan@hausmeister:~/tutorial/psysmon_output/event_list$ tree -l 3
3 [error opening dir]

0 directories, 0 files
stefan@hausmeister:~/tutorial/psysmon_output/event_list$ tree -L 3
.
└── smi-mr.sm-psysmon-tutorial-export_20220813_180049_119650-export_events
    ├── detection
    │   └── detection_20181025T000000_20181102T000000.csv
    ├── event
    │   └── event_20181025T000000_20181102T000000.csv
    └── execution_metadata.json

3 directories, 3 files
stefan@hausmeister:~/tutorial/psysmon_output/event_list$
Event list example
The following listing gives the first few lines of the exported event list.
id,public_id,event_start_time,event_end_time,n_stations,detection_scnl,detection_start,detection_end,catalog_name,event_type_id,event_type
1,smi:mr.sm.psysmon/tutorial/event/1-20181025T005546246250,2018-10-25T00:55:46.246250,2018-10-25T00:55:50.125000,2,"MIT:DPZ:XX:A,MOR:DPZ:XX:A","1540428946.24625,1540428948.20375","1540428950.125,1540428950.01125",tutorial,,
2,smi:mr.sm.psysmon/tutorial/event/2-20181025T011731106250,2018-10-25T01:17:31.106250,2018-10-25T01:17:35.220000,2,"MOR:DPZ:XX:A,PIL:DPZ:XX:B","1540430251.20375,1540430251.10625","1540430255.1,1540430255.22",tutorial,,
3,smi:mr.sm.psysmon/tutorial/event/3-20181025T030811236250,2018-10-25T03:08:11.236250,2018-10-25T03:08:14.108750,2,"MOR:DPZ:XX:A,PIL:DPZ:XX:B","1540436891.23625,1540436891.6687498","1540436894.10875,1540436893.12",tutorial,,
4,smi:mr.sm.psysmon/tutorial/event/4-20181025T031403091250,2018-10-25T03:14:03.091250,2018-10-25T03:14:05.485000,2,"MIT:DPZ:XX:A,PIL:DPZ:XX:B","1540437244.44125,1540437243.09125","1540437245.485,1540437244.74625",tutorial,,
5,smi:mr.sm.psysmon/tutorial/event/5-20181025T032009995000,2018-10-25T03:20:09.995000,2018-10-25T03:20:13.705000,2,"MOR:DPZ:XX:A,PIL:DPZ:XX:B","1540437610.19625,1540437609.995","1540437613.705,1540437613.095",tutorial,,
6,smi:mr.sm.psysmon/tutorial/event/6-20181025T041009463750,2018-10-25T04:10:09.463750,2018-10-25T04:10:11.786250,2,"MOR:DPZ:XX:A,PIL:DPZ:XX:B","1540440609.46375,1540440609.51625","1540440611.7862504,1540440611.55625",tutorial,,
7,smi:mr.sm.psysmon/tutorial/event/7-20181025T051523222500,2018-10-25T05:15:23.222500,2018-10-25T05:15:29.011250,2,"MIT:DPZ:XX:A,MOR:DPZ:XX:A","1540444523.5975,1540444523.2225","1540444529.01125,1540444525.99125",tutorial,,
Detection list example
The following listing gives the first few lines of the exported detection list.
id,start_time,end_time,channel,catalog,event_id,event_start_time,event_end_time
15,2018-10-25T00:55:46.246250,2018-10-25T00:55:50.125000,MIT:DPZ:XX:A,tutorial,1,2018-10-25T00:55:46.246250,2018-10-25T00:55:50.125000
19,2018-10-25T00:55:48.203750,2018-10-25T00:55:50.011250,MOR:DPZ:XX:A,tutorial,1,2018-10-25T00:55:46.246250,2018-10-25T00:55:50.125000
28,2018-10-25T01:17:31.203750,2018-10-25T01:17:35.100000,MOR:DPZ:XX:A,tutorial,2,2018-10-25T01:17:31.106250,2018-10-25T01:17:35.220000
29,2018-10-25T01:17:31.106250,2018-10-25T01:17:35.220000,PIL:DPZ:XX:B,tutorial,2,2018-10-25T01:17:31.106250,2018-10-25T01:17:35.220000
65,2018-10-25T03:08:11.236250,2018-10-25T03:08:14.108750,MOR:DPZ:XX:A,tutorial,3,2018-10-25T03:08:11.236250,2018-10-25T03:08:14.108750
66,2018-10-25T03:08:11.668750,2018-10-25T03:08:13.120000,PIL:DPZ:XX:B,tutorial,3,2018-10-25T03:08:11.236250,2018-10-25T03:08:14.108750
Exporting the event waveform
The looper collection node export waveform data provides the export of data of a given time span. The data can be exported in a format supported by obspy. Additionally, images of the waveforms will be created.
To export the event waveform data the event looper is used. This looper iterates through a list of events specified in the preferences. The processing stack child node is added to detrend the data before exporting it using the export waveform data child node.
Add the event looper
Disable the export events node in the export collection and at the event looper and the child nodes processing stack and export waveform data.
Configure the event looper
Open the event looper preferences and set the following preferences. We will set the preferences to export the events from 2018-10-25T22:00:00 to 2018-10-25T23:00:00 from the tutorial event catalog. The event data should be exported to the event_data directory created above.
events
| parameter | value |
|---|---|
| start time | 2018-10-25T22:00:00 |
| end time | 2018-10-25T23:00:00 |
| event catalog | tutorial |
components
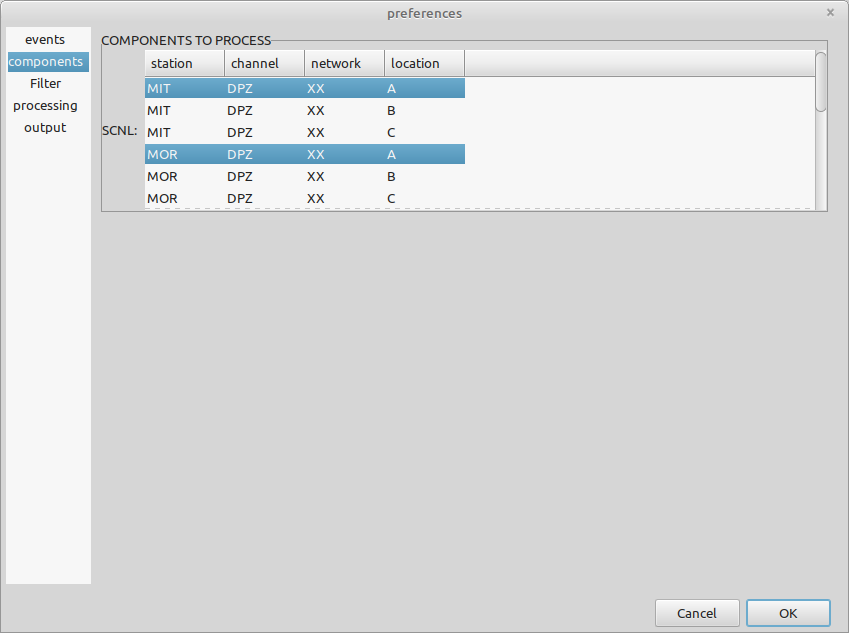
Select the components used for the detection: MIT:XX:A:DPZ, MOR:XX:A:DPZ, PIL:XX:A:DPZ and STO:XX:00:DPZ.
filter
No filters are used. Keep the empty default values.
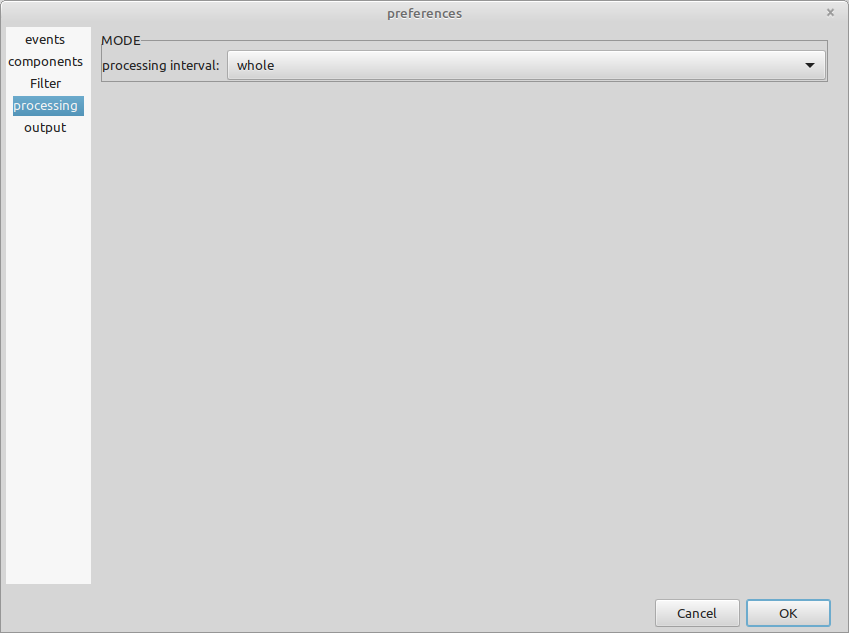
processing
Select the whole processing interval. This loads all events of the selected timespan and then iterates them. In case of long looper time spans and a large set of events it is useful to split the time span to process into smaller intervals.
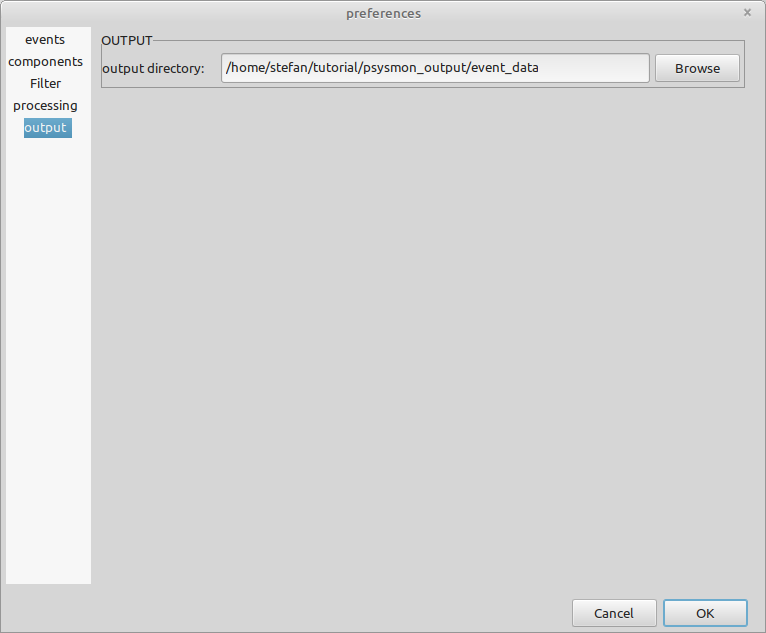
output
Select the path to the event_data directory in your tutorial directory structure.
Close the event looper preferences dialog.
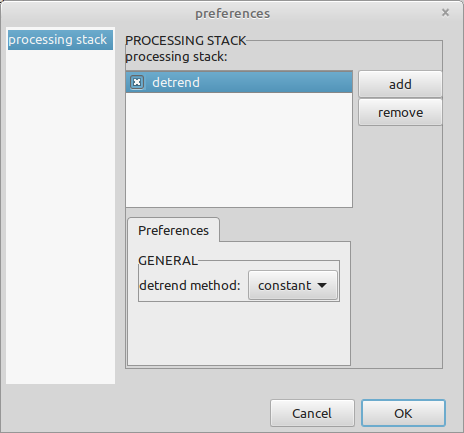
Configure the processing stack
In the processing stack only the detrend node is used.
Close the processing stack preferences dialog.
Configure the export waveform node
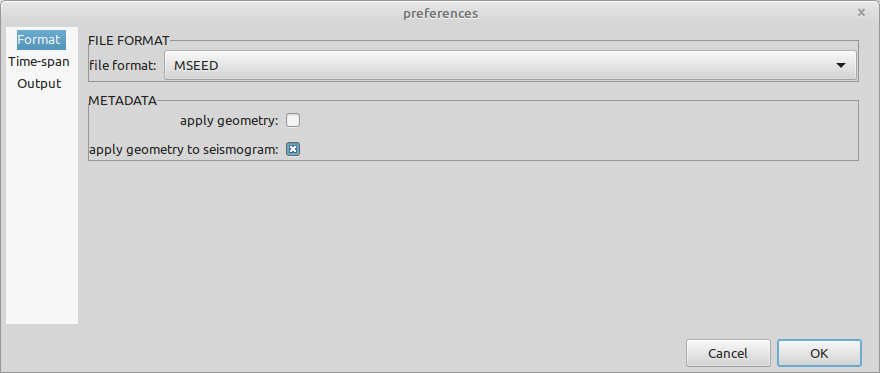
We will export the event data in miniseed format with the metadata of the original data files (e.g. serial of the recorder in the station field), but create waveform images using the metadata of the psysmon geometry.
Format
| parameter | value |
|---|---|
| file format | MSEED |
| apply geometry | unchecked |
| apply geometry to seismogram | checked |
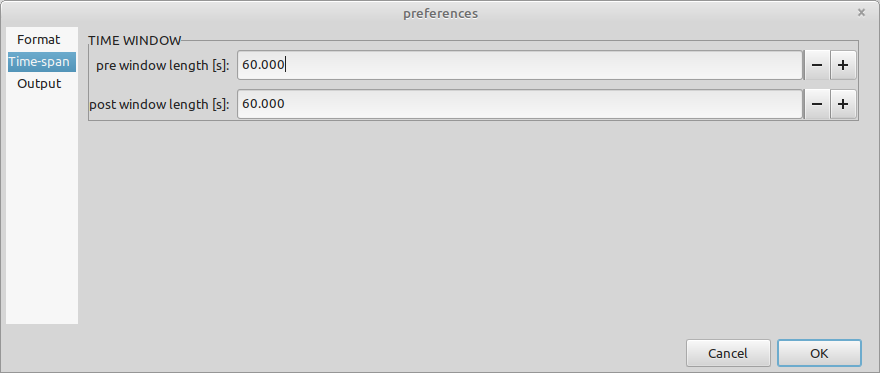
Time-span
Add 60 seconds before and after the exported event time span.
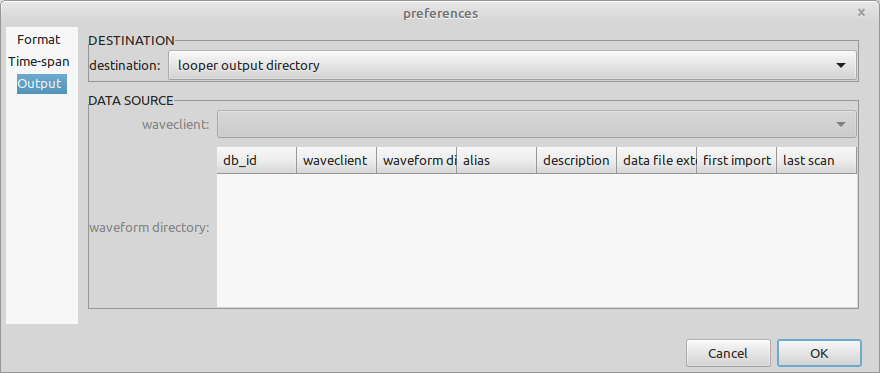
Output
Select the looper output directory to write the exported data to the output directory specified in the event looper.
Close the export waveform preferences dialog.
Execute the collection
Start the export of the events by clicking the execute button. The waveform data and the seismogram images of the selected events will be written to a directory in the selected event looper output directory.
Check the exported event data
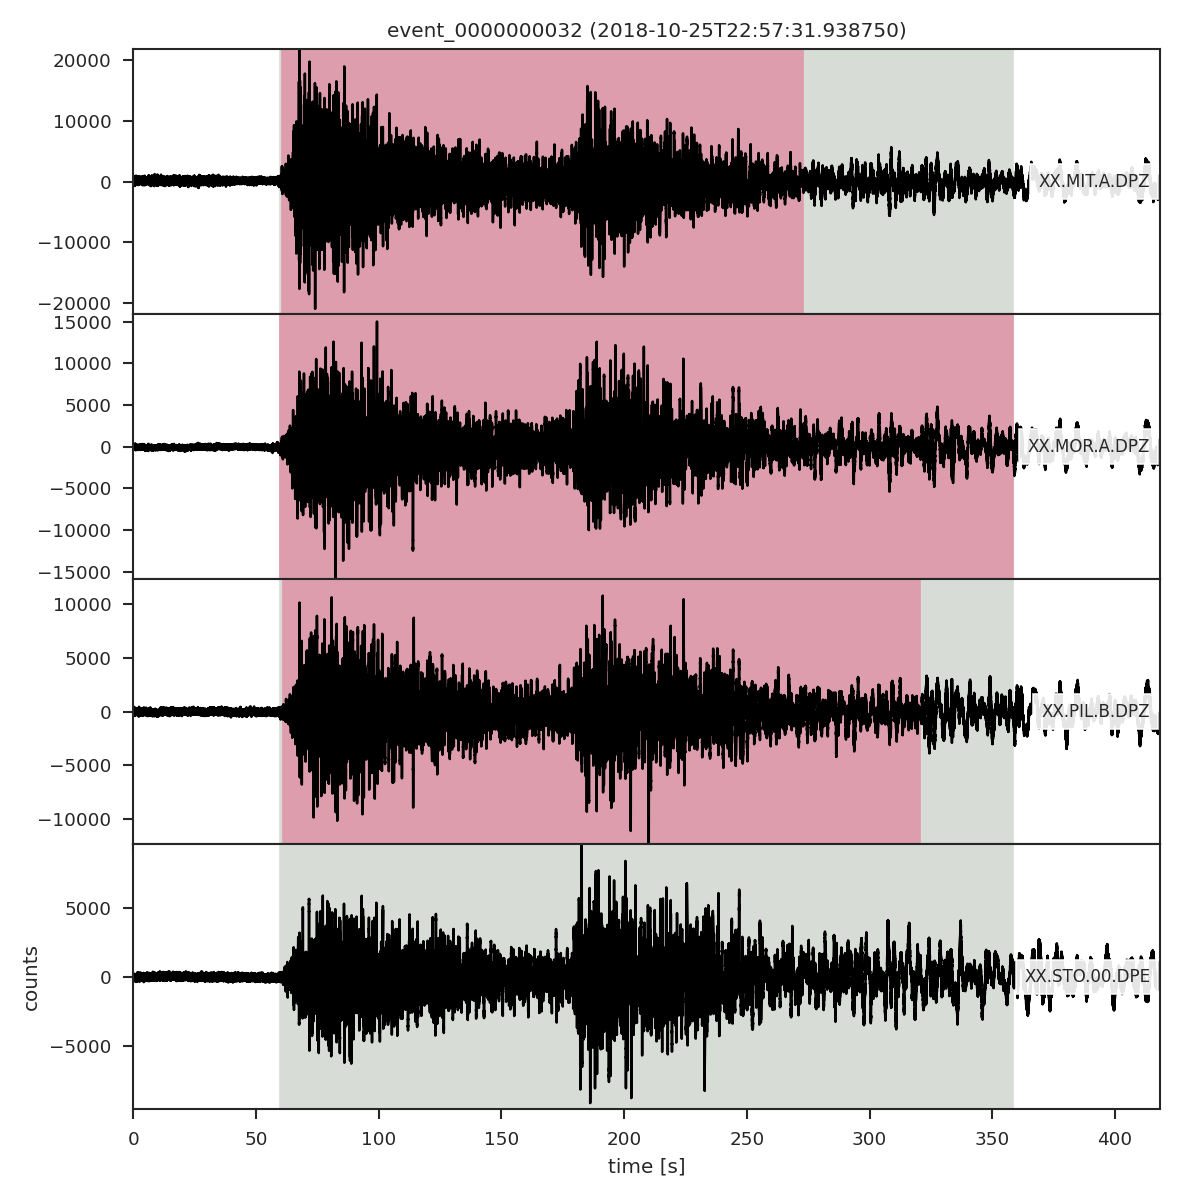
The waveform data is written to a directory structure split up into julian days. For each event a directory is created in the julian day directory. Inside the event directory an image file with the seismogram data and the minissed data in a dedicated directory structure is available.
The selected time span of this tutorial should have resulted in the export of the following two events. One of them is the earthquake with the event start time 2018-10_-25T22:57:31.938750 and event ID 32.
stefan@hausmeister:~/tutorial$ cd psysmon_output/event_data/
stefan@hausmeister:~/tutorial/psysmon_output/event_data$ tree -L 6
.
└── smi-mr.sm-psysmon-tutorial-export_20220816_112253_384857-event_looper
    ├── execution_metadata.json
    └── waveform
        └── 2018
            └── 298
                ├── event_0000000031_20181025T223705296250
                │   ├── 2018
                │   └── event_0000000031_20181025T223705296250.png
                └── event_0000000032_20181025T225731938750
                    ├── 2018
                    └── event_0000000032_20181025T225731938750.png

8 directories, 3 files
stefan@hausmeister:~/tutorial/psysmon_output/event_data$
The created seismogram image file should look like the following image.

Copyright © 2022 Stefan Mertl.
This article is licensed under a Creative Commons Attribution-ShareAlike 4.0 International license.
You are allowed to share the material, that means to copy and redistribute the material in any medium or format as long as you give appropriate credit to the creator and add the link to the license. You are allowed to adapt, that means to remix, transform, and build upon the material. If you adapt the material, you must distribute your contributions under the same license as the original.
If possible, please cite this article using the following form:
Psysmon Documentation, Sonnblick Events, "Event export", Stefan Mertl, 2022-08-27, www.mertl-research.at, licensed under CC BY-SA 4.0

